Profiling speed
Profilers keep track of a program as it runs, and look at the resources each part of them use. Because of Python's memory allocation, these tend to concentrate on processing time, but there are also memory allocation profilers. Let's look at what's available in Spyder. Open Spyder up now, and download, save, and open this file: test1.py.
You'll see the file makes a lot of random numbers in a square 2D list. It takes in a potential command line argument to set the side size of the 2D list. It calls a function for each row. It does this so function-calls scale linearly with size and we can see how this affects runtimes. Run the file as normal. To add a command line argument in Spyder, push the button on the run toolbar with the green triangle and the spanner on it. This will bring up the run configuration, where you can add command line arguments. Add 10 and run it. Try increasing the order of magnitude until you get a memory error.
Now remove the command line argument and run the file as normal, in preparation for the profiling.
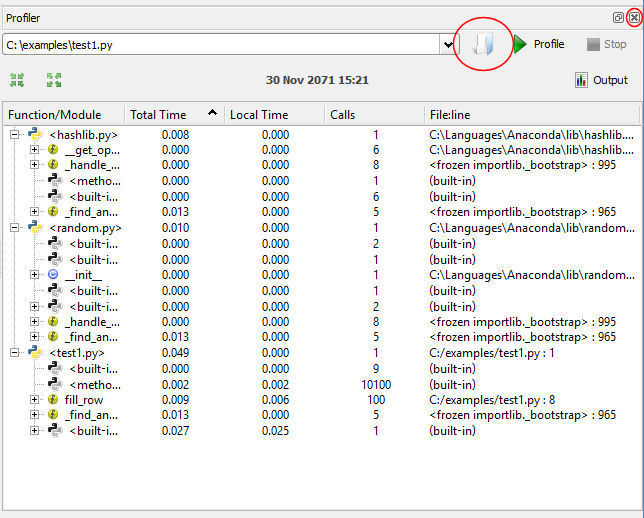
Now we'll see what's happening in the background with the profiler. The profiler in Spyder is basically a separate application that runs in the same GUI, so it won't run on a file just because it is in the editor. Under the Run menu, select Profile. This will put the profiler in the "Inspection Pane". We now need to separately open our file. At the top of the profiler pane, you'll see an icon like an open file (circled on image below). Push this and navigate to the test1.py file, opening it in the profiler. Note that because the profiler is separate, if you change the file you need to make sure it is saved in order for the profiler to pick up any changes – you can't just run it.
Press the "Profile" button to run the file through the profiler. You should see something like the above image. The first column shows all the code that runs, including any core Python code outside
of our code. In fatc, you'll see, our code is only a very small part of the total code running, which includes code in hashlib.py (working some of the background core Python) and random.py (which
does the random number generation). Find our code and expand it by clicking the + next to <test1.py>. You'll see function calls, and the function calls with those as a tree structure.
The second column is the total amount of time taken by a piece of code to run.
The third column is the time spent inside that function, as opposed to inside other functions called from that function. The fourth column is the number of times a piece of code is run, while the fifth is the filename and line number of the code.
Looking at the image above, you can see, for example, that the whole of test1.py took 0.049s to run, fill_row was called 100 times,
and took, aggregated across those 100 times, 0.008s to run in total.
Running our code with the command line arguments is a bit tricky, but possible. Essentially the profiler picks up the command line arguments from the configuration dialog when it starts, and then doesn't change. So, to configure the arguments, close the profiler using the little x window-close icon in its top right corner (also circled on image), set the argument in the standard configuration dialog, then reopen the profiler. Note that when you reopen the profiler the "profile" button may be grayed out. Click inside the combobox with the file address in it and press ENTER and it should reactivate – it just needs that particular file reloading again. Unfortunately you have to go through this process every time you change the arguments. Try a few values. As the profiler runs the code outside of Spyder, you may find it runs better than it does inside Spyder, which has an associated load.
- Using a profiler
- This page
- Profiling memory <-- next
- Answer

