![]()
![]()
![]()
1. Introduction
Logical reasonings are not based on mathematical formulae and do appear
to be popular in spatial reasoning, because in many application fields,
they are more closely to on expert than mathematical models. Many different
types of logical reasoning and logical operation must be performed on individual
or multiple data planes before they can be implemented in GIS softwares.
Most of such logical operations are done outside of the GIS software. A
good review of logical axioms for data used by GIS and spatial relationship
among classes can be found in ROBINOV (1989). Logical consistencies are
explained for example by KAINZ (1995) or HAKIMPOUR (1997). We try to find
a new method based on graph theory for implementation of logical spatial
reasoning in graphical software. Therefore many of spatial reasoning can
be done in GIS software automatically and in addition, logical consistensy
is guaranteed.
2.Base Graphical Rules and Models
In this paper our emphasis concentrats on spatial Boolean statement algebra (propositional calculus). General speaking, the following rules are based of the whole logical problems which come into considerations.
G S1 (First rule of demonstration):
Each spatial statement (p, q, r ) will be shown by a circle. If the statement is true, then it will show with a filled circle. The false one is shown by crossed circle. A circle is a node from graph theory point of view.
A S2 (Second rule of demonstration):
Each implication ( p => q ) is shown by directed arc from p to q.
G R1 (First general rule of spatial reasoning):
Each circle can be filled or exclusively crossed. In the same time a circle can not be filled and crossed. The corresponds logical axiom reffers to contradiction axiom.
A R2 (Second general rule of spatial resoning):
Let p be a filled circle. If there exits an arc from p to q, then q will be filled. This rule corresponds to true material implication.
B R3 (Third general rule of spatial reasoning):
If there exist an arc from p to q and q is a crossed circle, then p
will be a crossed circle.
3. Graphical Models For Different Kind of Spatial Reasoning
3.1 First Case
In the first case, the problem is faced with atomic statements such as p <=> q, (p V q) => r, p Vq, p => (q L r) where symbols L, V, <=> , mean logical and, logical or and mutual implication, respectively. There is no negation of atomic statement.
We can add another rule for classified data and also for polygon topological spatial data structure as follows:
A A R4 ) Let polygons or classes of data be the statements of spatial reasoning.
Then, there exist at most one filled circle, it means, if a statement shown by filled circle then other statements will show by crossed circles.
3.2 Second case
In this case, there is negation of some statements. Beside of previouse rules there are other rule.
B S3) Each negative statement will be shown parallel of positive statement.
A B R5) If one circle is filled in the first row, then other circle in its part will be crossed.
§ Example :
There is a construction plane. The conditions are listed below:
i) It is not allowed to construct hospital with repair shop and with workshop. But, in the plane should predict at least one of hospital or clinic, gas station or kiosk and one of car repair shop or parking.
ii) If repair shop is constructed, then gas station shoud be cosntructed. Workshop and equipment shop should construct together.
iii) Clinic can not be constructed without kiosk and highway can not be constructed without gas station.
iv) Construction of kiosk means parking can not be constructed. In the plane should predict at least one of asphalted road or parking, one of kiosk or asphalted road, one of highway or asphalted road. Also, kiosk and equipment shop can not be together.
Let identify hospital with B, repair shop with A, workshop with D, gas station with G, Asphalted road with H, clinic with C, parking with L, kiosk with F, highway with K, and equipment shop with E.
Now, the conditions (i) to (iv) translate to
i) B => A , B => D , B => C , F => G , A => L
ii) A => G , D => E , D => E
iii) F => C , G => K
iv) F => L , L => H , F => H , K => H , F => E
where A means not A.
The base map illustrated as figure (1.a). The figure (1.b) shows implementation of (s2). The figure (1.c) shows implementation of (R1) to (R3), and (R5), when A to be true or to be filled circle. The figure (1.d) shows implementation of the rules, when A to be crossed circle.
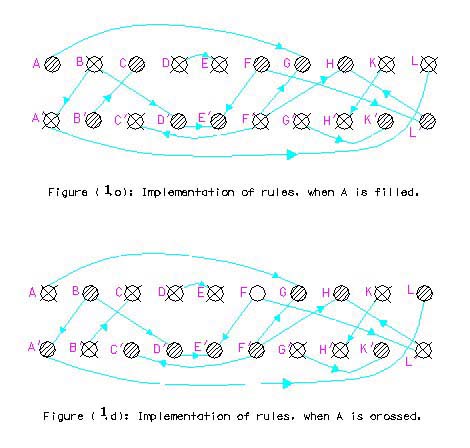
If A is filled then the set {A,C,F,G,H} is selected else if A is crossed,
then the set {B,g,H,L} is selected. We alse to start arbitrary from each
circle. It is possible to start from a circle which based a designer opinion
has higher priority.
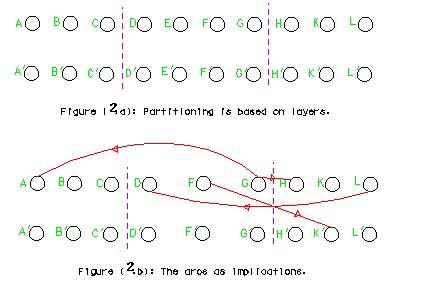
§ Example :
The best places for residential development in the urban periphery is requested. There is some topologically structured database layers. They are land properties, slope map, and geological map. Some selection should be performedb, before doing overlay modelling (as an example please see figure 8.13 in LAURINI & THOMSON (1992)). The given condition are as following:
i) The property of land must be FOR SALE or FOR RENT .
ii) The government owned land has to remove from consideration.
iii) If SLOPE > %5 then SOIL= STONE.
iv) If %3 <= SLOPE <= %5 then SOIL can not be SAND.
v) If SLOPE >= %5 then land area must be FOR SALE.
vi) If SOIL= MARL then SLOPE <=%3.
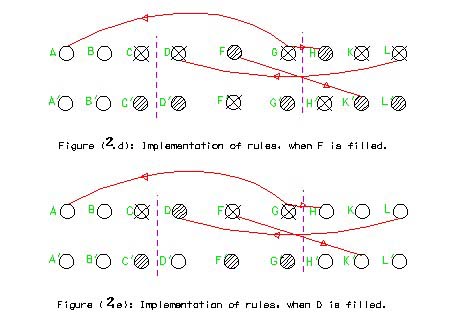
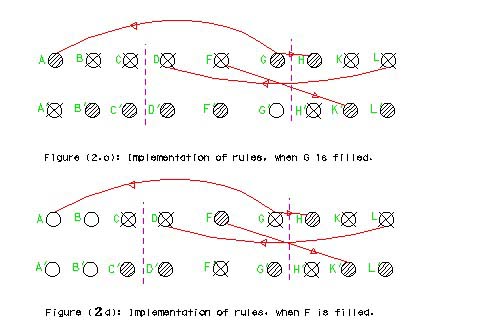
Let identify FOR SALE with A, FOR RENT with B, owned by government with C, SLOPE <= %3 with D, %3<=SLOPE <= %5 with F, %5 <= SLOPE with G, STONE with H, SAND with K and MARL with F. The graph models are illustated by figure 2. In this example, the rule R5 is used.
3.3 Third case
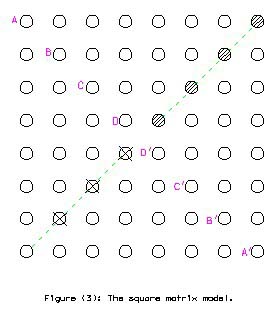
A more complex case may occurs when a statement contents (p L q) => r and p => (q V r). The mentioned statements can not be dissolved to the basic statement (p => q). In this case a square matrix model with 2n*2n circles can be used.
A A S4) In the square model, the first n diagonal circles will show the main n statements. The second n diagonal circles are placed by their negatative, invertly.
A B S5) The circles in low triangle show logical and between coresponding statements. That means,
cir(i,j) => (cir(i,i) and cir(j,j))
i>j
where cir(i,j) means the circle located in the ith row and jth column.
B B S6) The circles in high triangle show logical or. That means,
cir(i,j) => (cir(i,i) or cir(j,j))
i<j
B B R6) All cir(i,j) when i>j and i = 2n-j+1 and j = 1, ,n, will be crossed.
A A B R7) All cir(i,j) when i<j and j = 2n-i+1 and i = 1, ,n, will be filled.
A B B R8) If cir(i,j) (i>j) is true, then cir(i,i) and cir(j,j) will fill.
B B B R9) If cir(i,j) (I<j) is false, then cir(i,i) and cir(j,j) will false.
AA B B R10) If cir(i,i) (i=1,...,n) is filled, then cir(2n-i+1,2n-i+1) is crossed and vice versa.
3. Fuzzy Case
We are able to generalize all previously explained models to fuzzy cases. Both circles and arcs can implement fuzziness in proposed graph models. In this situation a circle have different colours or different graylevels. In addition, an arc can be weighted. The compositional rule of inferences can be done with generalized modus ponens, modus tollens and hypothetical syllogism. In similar way with crisp situation, the explained graph models are achievable.
4. Conclusion
There are many types of spatial reasoning and logical operation that are run outside of GIS environment. Within the framework of the peresented work, A new method is suggested. This method is based on graph theory for implementation logical reasoning in GIS environments.
Some direct acceptable advantages are list as follows:
è Many types of logic spatial operation can be run in a CAD software.
è The logical operations perform easily and safely.
è In this method many of cognition ceriteria can be easily stabilished easily.
At the end it is notable that we are working to develop the presented method on
fuzzy spatial reasoning. This method is able to use different degree
of colour for each circle and different degree of weight for each arc.
4. References
1) Hakimpour E. (1997): Logical Consistency as an Element of Spatial data Quality; papers collection of 4th conference on Geographic Information System, National Cartographic center of Iran.
2) R. Laurini and D. Thomson (1992): Fundamentals of Spatial Information System; Academic Press.
3) Kainz W. (1995): Logiacal Consistency ; In: Guptill S.C. and Morrison J.L. (Ed.S); ICA Commision on Spatial Data Quality.
4) Robinove C.J. (1989): Principles of Logic and the Use of Digital Geographic Information System; In: W.J. Ripple (Editor): Fundamental of Geographic Information Systems: A Compendium; American Society for Photogrammetry and Mapping.