![]()
![]()
![]()
In this paper, a technique is presented based on rank correlation that is capable of analysing the association between the distribution of customers and background demographic characteristics. The Spearman rank correlation coefficient has been programmed within MapInfo using the Mapbasic language. The method is directed towards business needs rather than towards technical niceties. The analysis of the association between customers purchasing motor vehicles and demographic variables from the Census for a region in Sydney, Australia, is used as a case study to demonstrate the potential of the technique.
Tavakoli (1993) has summarised the factors contributing to the increased penetration of GIS in business and marketing, key ones among which include:
Despite the widespread adoption of GIS by the business community,
there is an increasing awareness that current proprietary GIS packages
are limited in their capability to address business objectives because
they lack appropriate analytical tools. One aspect of developments in marketing
research is the increased emphasis being placed on the use of statistical
methods, particularly in unravelling the relationships between a large
number of demographic characteristics from Census data and the profiles
of customers in an organisation's database. Most packages for statistical
analysis are not particularly relevant to marketing and do nothing to help
a largely non-technical user community. There is a need to develop "black-box"
automated analysis tools, with robust performance, to investigate the spatial
associations between customer characteristics and those of background populations
in defined catchment areas to generate additional information to support
effective marketing activities.
In this paper, a technique is presented based on rank correlation that is capable of analysing the association between the distribution of customers and background demographic characteristics. The Spearman rank correlation coefficient has been programmed within MapInfo using the Mapbasic language. The method is directed towards business needs rather than towards technical niceties. The analysis of the association between customers purchasing motor vehicles and demographic variables from the Census for a region in Sydney, Australia, is used as a case study to demonstrate the potential of the technique.
Marketing analysis covers a wide range of topics. Beaumont (1991) notes that conventionally the marketing mix can be summarised as the four Ps: product, price, place and promotion. He suggests that these should be supplemented with a fifth P - that of data processing , which makes it possible to integrate GIS and the marketing mix (see Figure 1). This highlights the central role GIS can play as a tool to integrate the various components of the marketing mix to assist strategic decision making.
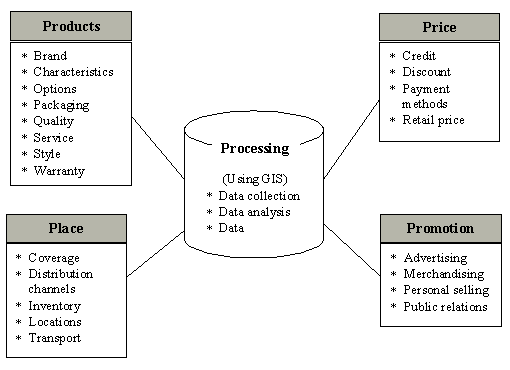
Figure 1. The integration of the marketing mix ('five Ps')
[ after Beaumont, 1991, P140]
Beaumont (1991) has also provided a useful list of the kinds of questions that need to be answered by marketing management (see Figure 2). This shows the various dimensions of a marketing manager's decisions that could be supported using GIS to interrogate various data sets that are typically held by an organisation. These illustrations demonstrate the power of GIS in broadening the perspective of marketing analysis in market research. Birkin (1996) has argued that GIS provide useful technical support for data management in a competitive environment by integrating various sources of information, as well as producing attractive graphic displays of data in map form.
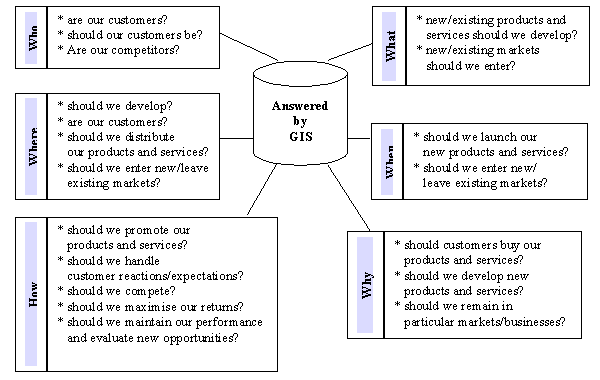
Figure 2. Fundamental questions in marketing management
[ after Beaumont, 1991, P140 - 141]
Marketing research exists to serve the information needs of both operations and strategy development in the business environment. The methods developed in marketing research are as diverse as the problems addressed, and methodologies and concepts have been borrowed from a variety of disciplines. Among these, statistical methods have become very important: most of the standard statistical analytical procedures have been widely applied in marketing research as part of what Lehmann (1985) describes as a general trend towards a more quantitative approach to marketing research.
An important development that has increased the potential for using GIS and statistical techniques in marketing is the increasing availability of relevant Census data in digital form, widely developed geodemographic data bases, as well as Census data that is already integrated with GIS software (Beaumont and Inglis, 1989; Flowerdew and Goldstein, 1989; Batey and Brown, 1995; Martin, 1995; Martin and Longley, 1995; Waters, 1995). Census data, collected on a regular basis, are the source of the most complete, reliable, and widely available demographic information for market research and this has promoted a number of highly successful geodemographic systems in marketing, for example ACRON (A Classification of Residential Neighbourhoods) and MOSAIC in the UK, LIFESTYLES and VISION in the USA. Demographic trends, which form the underlying framework for customer analysis, requires access to and appropriate exploitation of official and other external demographic data. It is also important that businesses make full use of the data internally available, that is the data associated with products and existing customers derived from records of purchase. The power of a GIS in these areas is its ability to manage data from a number of different sources and its capability for interactive visualisation in exploring data and the results of analyses. So GIS software and Census data are often assembled as packages. For example, ArcView may be purchased together with some Census data, and CData96, data from the 1996 Australian Census of Housing and Population on CD Rom, makes full use of the features and tools of MapInfo Professional.
As the benefits of collecting more customer information are gradually realised, the potential for systems that analysis customer data as well as external data sources has dramatically increased. GIS geo-processing functions provide a means for enhancing databases in two respects (Openshaw, 1995): first by linking with other spatial data (e.g. geodemographics), and secondly by adding value to databases. For example, given the strong association between social status, income and location (e.g. by postcode or suburb), the analysis of customer addresses makes it possible to match these with income and social status. Customer data with addresses are now routinely collected for billing and maintenance purposes, and these spatially based customer files can be used directly to describe the current customer base through profiling. Flowerdew and Goldstein (1989) suggest that the most important market research data are product-purchasing profiles, which give social and demographic profiles of those people most likely to purchase a particular product or use a particular service. The profiles of existing customers can be used to highlight the potential for cross-selling services.
Although most widely used GIS packages perform a range of functions, many of them have weaknesses when it comes to business applications. Combining GIS and other techniques will create appropriate and diverse approaches to problem solving (Maguire, 1995). One advantage of linking statistical methods with GIS is to integrate GIS capabilities with the power of statistical analysis, and to effectively use data from different sources for market analysis. Another advantage of this is that users can visualise spatial data in different forms, for example visualise the spatial distribution of data on maps prior to further statistical analysis, and visualise spatial data in various statistical graphs and diagrams which may yield more insights into the nature of distributions. In this way, the application of GIS in market analysis may be seen as a tool for reaching a desired solution for the client and not merely as an end in itself (Cresswell, 1995).
Therefore they provide a way of determining which demographic variables, taken from Census data, best "agree" with an existing customer profile, taken from a business' records. These Census variables can then be considered the best predictors of potential households within a statistical area that might purchase similar products.
When searching for such demographic variables, the major concern is to predict the order of pairs of cases. In other words, does the fact that one area has more high income people than another area help to predict whether that area also has more people who might buy a particular brand of product than another? Considering that both census data and business data have a wide range of possible values, the scales could be longer, the non-parametric Spearman rank correlation coefficient ( r s ) is available to measure the strength of correlation(Lehmann and D'Abrera, 1998). The measure of strength of relationship using r s is based on a scale ranging from -1.00 (a perfect negative correlation) to +1.00 (a perfect positive correlation). On this scale, zero indicates no correlation at all.
The method proposed in this paper uses the Spearman rank correlation coefficient which computes the correlation between two sets of ranks using the following formula:
 (1)
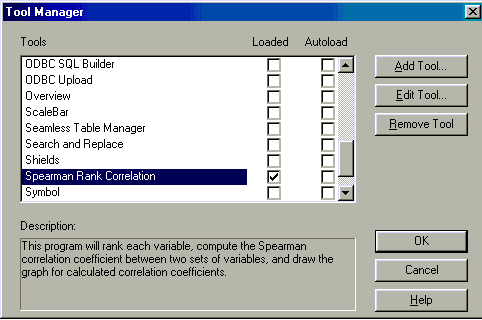
(1)In the analysis tool reported on in this paper, MapInfo is used for the association analysis since CData96 is designed specifically to be used with this particular software. Mapbasic, MapInfo's Macro language, has been used to develop the analysis tool and to call the Spearman rank correlation within Mapinfo. Using MapInfo's graphical user interface (GUI) and the tool added (Figure 3), the user can select any pair of variables (see Figures 4 and 5) simply by clicking the tool box. The analytical procedure, from the ranking of the variables, the calculation of the correlation coefficients, and the display of the results on graphs, is therefore implemented completely automatically in a user friendly environment.
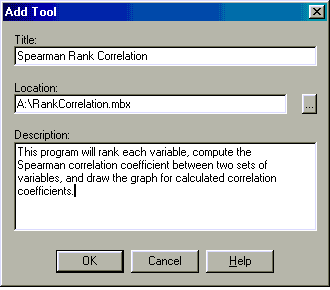
Figure 3. Screen capture for adding the developed tool
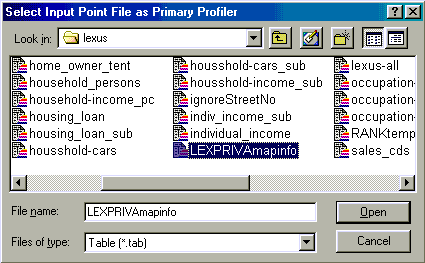
Figure 4. Screen capture of selecting customer point data
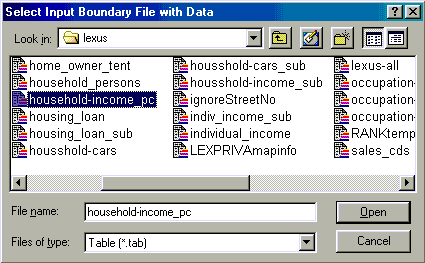
Figure 5. Screen capture of selecting Census boundary data
The Census data stored in the tables in CData96 is referenced to Census Collection Districts (CDs) although the data can be aggregated into any other Census or customer boundaries, e.g. postcodes, Local Government areas, sales territories, or marketing areas. Because most customer spatial distribution data are point data, the developed tool has been designed to count customer points according to the boundaries that contain the Census data (or other data). Then the boundary areas are ranked based on the number of customers (X) and the values of each census variable (Y) respectively, giving rank 1 to the area with the highest value since these will have the most positive predisposition to purchase the product. The rankings are put into a new table (see Figure 6), and based on this new table, calculation of r s is implemented and the values of r s are displayed as MapInfo graphs.
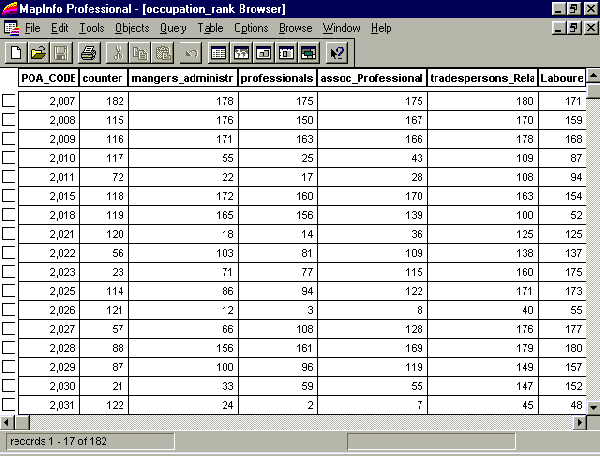
Figure 6. The table of rankings
Since all of the above procedures are automatically performed during processing, the message window has been designed to display the status of the particular analysis for the user (Figure 7), and let user to understand the performance of this kind of "black-box".
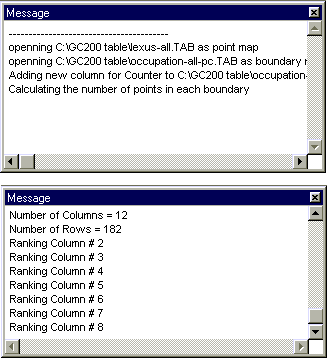
Figure 7. Screen capture of message windows
Because the point customer data have been aggregated to statistical areas, other maps can be produced showing the extent of product penetration and provide more information about catchment areas.
The system allows the user to identify relationships in a straightforward way with only a minimal understanding of statistics. The user is not presented with complex and cumbersome choices, and the technical issues are kept in the background. Seeing relationships easily on graphs and maps reinforces the power of the system for interrogating data and contributes to a better understanding of demographic predictors.
Imagine that an automobile dealer wants to identify its potential customer base in a systematic way. Based on data for a period of six months car sales, the following procedures are involved:
Figure 8. Screen capture of Census tables from CData96
Figures 10, 11, and 12 show examples of the results of the analysis. Figure 10 indicates a strong positive correlation (r s = +0.73) between the variable "A$2000 or above" in the Weekly Family Income table and the distribution of existing customers. This variable therefore can be considered as one of the best predictors of market potential. Figure 11 shows the association with Occupation: the high correlations with variables "Mangers_Administrators" and "Professionals" indicate that these are two other good predictors of potential customers. The variable "A$1500_more" from the Monthly Housing Loan Repayment table is a good predictor as well (Figure 12). On the other hand, the negative correlations shown in Figure 11 between the distribution of existing customers and the variables "Labourers_Related Workers" and " Intermediate Production_Transport Related Workers" from the Occupation table suggest that these demographic variables are poor predictors of market potential.
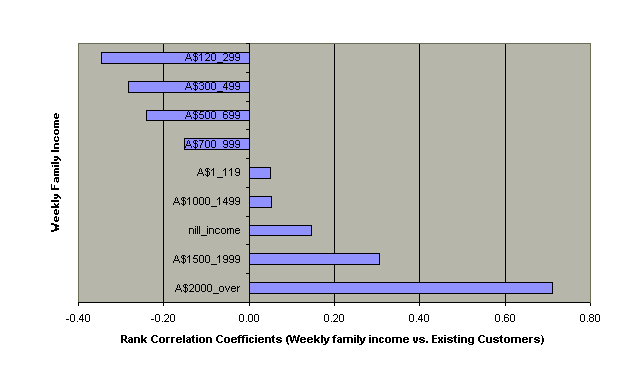
Figure 10. Correlations between weekly family income and existing customers
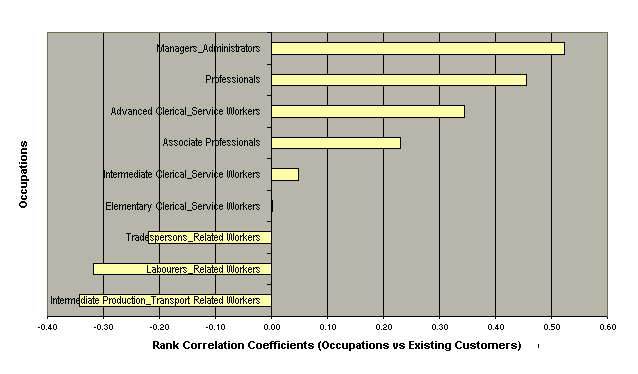
Figure 11. Correlations between occupations and existing customers
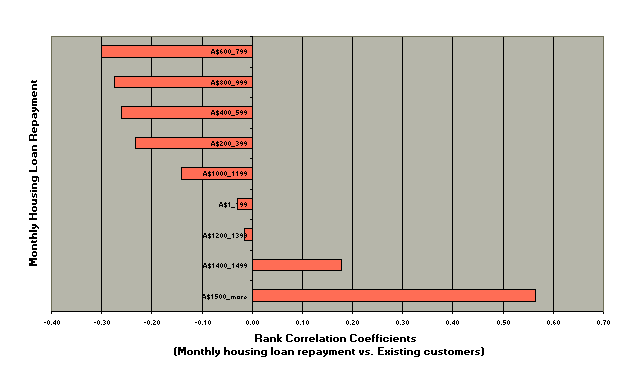
Figure 12. Correlations between monthly housing loan repayment and
existing customers
Figure 13 shows the products penetration status. From the map it is obvious that sales are mainly concentrated in the vicinity of the sales office where 31 postcode areas account for 60 percent total sales. The remaining 40 percent sales are located in the other 151 postcode areas.
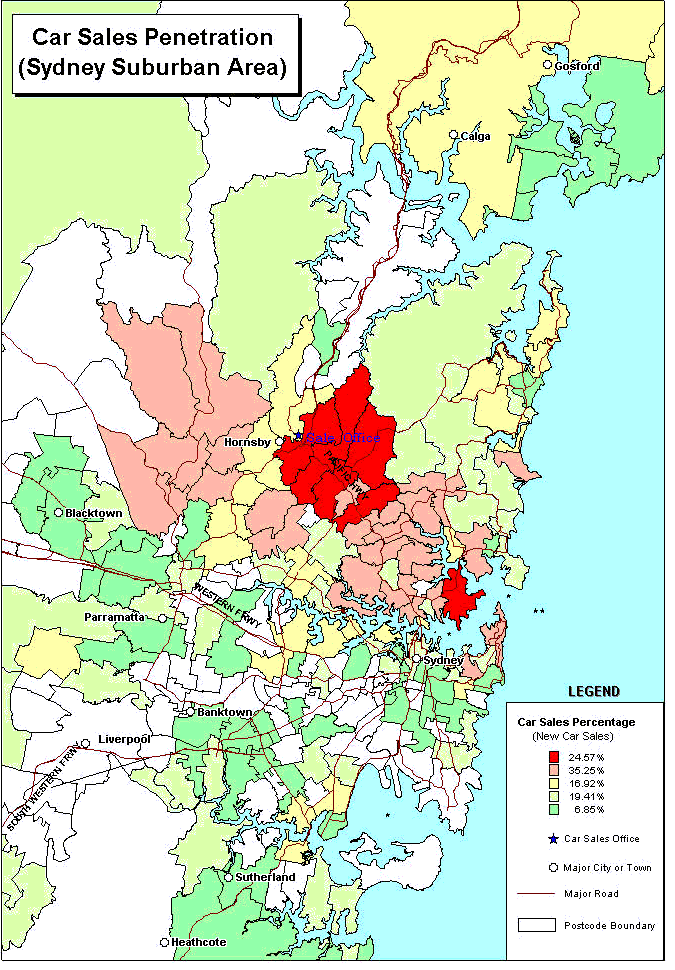
Figure 13. Car sales penetration
Analysis of the relationship between sales data and Census data suggests the socio-economic characteristics of customers that are most likely to buy the product or to spend the most. Using this knowledge and the information from businesses' data base, it is easy to find the location of potential customers having similar socio-economic characteristics and hence to target specific sub- groups by statistical areas which could be responsive to the marketing of the same or similar brands of motor vehicles.
Although GIS are increasingly being used as an information technology tool by the business community, more effort still needs to be invested in GIS development for providing analysis in such mission-critical areas as site selection, target marketing, prospect analysis, territory allocation and media planning.
Further research is being conducted to extend the analysis based on the tool developed in this paper to combine significant demographic predictors into an index, and to call upon GIS to perform various kinds of spatial analysis that together can be used to identify specific geographical areas (i.e. postcode areas) to be targeted in marketing.