


Extending Map Algebra with Flag Operators
Douglas R. Caldwell
U.S. Army Topographic Engineering Center, 7701 Telegraph Road, Alexandria,
VA 22315-3864, U.S.A.
E-mail: caldwell@tec.army.mil
Abstract
Map algebra and cartographic modeling provide powerful tools for analyzing
and manipulating spatial data. This paper introduces a new map algebra
operator, the flag operator. Flag operators are primarily used to evaluate
neighborhoods and zones, so they are related to the focal and zonal families
of operators. However, they differ in the way they analyze the contents
of the the neighborhoods and zones. Flag operators evaluate an expression
and flag or mark the locations where the condition is met. This paper describes
flag operators using specific examples and then presents a general model
for specifying them. The FOCALFLAGMAX operator, which measures locational
dominance, is described in detail. The FOCALFLAGMAX operator extracts surface
structure, including peaks, ridges, and flat areas.
1. Introduction
Joseph
Berry's (Berry, 1987; Berry, 1993a; Berry, 1993b; Berry, 1995) map
algebra and Dana
Tomlin's (Tomlin, 1990) cartographic modeling research have greatly
influenced the geographic information system (GIS) and geocomputation communities
by providing a high-level computational language to describe geographic
data processing. Cartographic modeling is based on the concept of map layers,
operations, and procedures. The purpose of the language is to create new
map layers using existing map layers and operations that are sequenced
in procedures. It takes a location-oriented perspective or 'worm's eye'
view by computing new values for locations based on the location itself,
its neighborhood, a related zone, or the entire dataset.
Tomlin
explored map algebra and cartographic modeling, first as a student at Harvard
University, and later as part of his doctoral dissertation under Dr.
Berry at Yale University. His work resulted in the Map
Analysis Package (MAP). The influence of map algebra, cartographic
modeling, and MAP has extended beyond the university research community.
It is now integral to public domain and commercial software packages. Map
algebra and cartographic modelling capabilities are found in the Academic
Map Analysis Package (aMAP), ARC/INFO
Grid, Idrisi,
MFWorks,
MGE
Grid Analyst,
OSU
Map-for-the-PC,
PC
Raster, and the Professional
Map Analysis Package (pMAP).
Map algebra has evolved and continues to evolve as new extensions are
developed and implemented. Some of these extensions enhance the basic capabilities,
such as the block function operators implemented in the ARC/INFO Grid extension.
Other extensions considerably expand map algebra. Software, such as PC
Raster, adds time, dynamic processing, and the third dimension to the
traditionally static, two-dimensional map algebra. This paper continues
the evolution of map algebra with the introduction of a new operator, the
flag operator.
2. Flag Operators
Flag operators are related to focal and zonal operators, but differ from
them in a significant way. They use the neighborhoods and zones of these
operators, but analyze the contents differently. Focal and zonal operators
focus on assigning new values based on WHAT meets a required condition,
while the flag operators identify and mark locations WHERE a required condition
is met. For each location, the traditional operators evaluate a condition
and then return a value that is assigned to a source location. Flag operators
evaluate a condition related to a location and then flag or mark the locations
that meet the condition.
2.1 A Zonal Example
A simple example using the ZONALMAX and ZONALFLAGMAX operators makes the
difference between the operators clear. ZONAL operators use two grids as
inputs, a zone grid and a value grid. The zone grid identifies the zones
or summary areas to be used in the operation, while the value grid provides
the values that are evaluated within each zone. The ZONALMAX operator (Figure
1c.) evaluates location in the zone grid and determines the maximum value
in the value grid for each zone in the zone grid. The operator then assigns
this maximum value for each zone to every grid cell in the zone. It is
looking at what the maximum value is in a zone when assigning values to
locations, not 'where' the maximum value is located.
| 4 |
4 |
4 |
2 |
1 |
| 5 |
6 |
2 |
1 |
1 |
| 5 |
5 |
2 |
1 |
4 |
| 2 |
1 |
0 |
2 |
1 |
| 2 |
4 |
1 |
0 |
0 |
a. Value Grid |
| 1 |
3 |
3 |
3 |
3 |
| 1 |
1 |
3 |
3 |
3 |
| 1 |
1 |
3 |
3 |
3 |
| 3 |
3 |
3 |
2 |
2 |
| 3 |
3 |
3 |
2 |
2 |
b. Zone Grid |
| 6 |
4 |
4 |
4 |
4 |
| 6 |
6 |
4 |
4 |
4 |
| 6 |
6 |
4 |
4 |
4 |
| 4 |
4 |
4 |
2 |
2 |
| 4 |
4 |
4 |
2 |
2 |
c. ZONALMAX Result |
| 0 |
1 |
1 |
0 |
0 |
| 0 |
1 |
0 |
0 |
0 |
| 0 |
0 |
0 |
0 |
1 |
| 0 |
0 |
0 |
1 |
0 |
| 0 |
1 |
0 |
0 |
0 |
d. ZONALFLAGMAX Result |
Figure 1. Comparison of ZONALMAX and ZONALFLAGMAX Operators
(Colors relate to Zones: 1=Green, 2=Yellow, and 3=Blue)
|
The proposed ZONALFLAGMAX operator (Figure 1d.) also evaluates two grids,
a zonal grid and a value grid. For each zone in the zonal grid, the operator
identifies the maximum value. Up to this point, it is similar to the ZONALMAX
function. However, instead of assigning the maximum value to every grid
cell in a zone, it assigns the a value of 1 to the cell or cells containing
the maximum value and a 0 or NULL value to the other cells. It flags where
the maximum value occurs within each zone. The ZONALMAX function is equivalent
to a two-step process which applies 1) the ZONALFLAG operator and 2) a
CON operator which sets the output grid to 1 if the value of the value
grid equals the ZONALFLAG output grid value and 0 if it does not.
The ZONALFLAGMAX operator can be used for many practical applications.
Using a Digital Elevation Model (DEM) as the value grid and a map of states
as the zone grid, the ZONALFLAGMAX operator identifies the highest locations
in each state.
2.2 A Focal Example
A FOCALMAX operator evaluates a neighborhood around each cell. It looks
at 'what' the maximum value is in the neighborhood and assigns the maximum
value to the source or center cell. (see Figure 2b.) Information on 'where'
the maximum value occurs is lost. The FOCALFLAGMAX flat identifies the
location where the maximum value occurs (Figure 2c.). Each time a cell
is visited, its value is incremented by one.
|
a. Input
|
b. FOCALMAX
|
c. FOCALFLAGMAX
|
| Figure 2. Comparison of FOCALMAX and FOCALFLAGMAX
Operators |
The effect of a 3 X 3 neighborhood on a individual cell's flag count
can be seen in the animated GIF image in Figure 3. The cell of interest,
the center cell, is highlighted in blue in the first frame. The moving
window is highlighted in yellow and the cells with the maximum values in
the window are highlighted in red. Whenever the center cell has the maximum
value in the moving window, the flag count is incremented by 1. The center
cell in this example has a flag count of 3.
 |
| Figure 3. Cell Flag Count Animation |
With a FOCALFLAGMAX operator, a cell is visited multiple times, as the'moving
window', which defines the neighborhood, passes over it. Because grid cells
are visited multiple times, the results of the FOCALFLAGMAX operator can
be reported in three ways: 1) as a binary flag that simply records whether
the cell is the maximum of value of any window passing over it, 2) as a
flag count that stores the number of times the cell was the maximum value,
or 3) as a normalized flag that normalizes the count by dividing the count
by the number of times the cell is visited.
With a binary flag, cells would be assigned a value of 1, if flagged,
and 0 or NULL otherwise. With a count flag, the value range is dependent
on the size of the neighborhood. For a 3 X 3 neighborhood, a cell could
be visited a maximum number of 9 times, so cell values could range from
0 to 9. For a 5 X 5 window, the cell values could range from 0 to 25. Because
the count varies depending on the neighborhood size, the total count may
be difficult to interpret across window sizes. The normalized flag stores
a normalized count, i.e., the count divided by the number of cells in the
window. For the 5 X 5 window with a count of 10, the normalized value would
be .4, while a count of 25 would have a normalized value of 1.
3. Flag Operator Basics
Flag operators are built from two components: an analysis area and a conditional
expression. For each source cell, the flag function evaluates an expression
using the source cell's analysis area.
3.1 Analysis Area
The analysis area is the area over which the conditional expression is
evaluated. For a ZONALFLAG function, the analysis area is a zone. For a
FOCALFLAG function, the analysis area is the neighborhood. The neighborhood
is commonly a rectangular window, such as a 3 X 3 or 5 X 5 window, but
the size and shape of the window can be user defined.
3.2 Conditional Expression
Within an analysis area, flag functions identify and flag grid cells which
are true for a given conditional expression. While any conditional expression
may be used, but it is most common to create a conditional expression from
a value-constrained function and a logical operator.
3.2.1 Value-Constrained Function
Value-constrained functions are a subset of grid functions. A value-constrained
function is a function that returns a value, which falls within the range
of values in the analysis area. Valid location-constrained functions would
include majority, minority, maximum, mean, median, and minimum functions.
For an analysis area containing cells with values between 22 and 35, all
value-constrained functions would return a value between 22 and 35. Other
map algebra functions, such as range, standard deviation, sum, and variety
functions produce values that may or may not fall within the range of values
in the analysis area. For example, if an analysis area contained cells
with values between 22 and 35, the range of values would be 13, which is
not between 22 and 35.
3.2.2 Logical Operators
Logical operators include =, <>, >, <, >=, and <=. Each value-constrained
function has an associated set of appropriate logical operators. For example,
the maximum function is associated with the = and <> logical operators.
This is because any other logical operator associated with the maximum
function would include all the cells (<=), be equivalent to the maximum
(>=), be equivalent to everything but the maximum (<) or be meaningless
(>). A list of valid value-constrained functions and their associated logical
operators is provided in Table 1. The utility and potential meaning of
the various functions with their logical operators is a subject that requires
further exploration.
| Function |
Description |
Logical Operator |
| MAJORITY |
Most frequently occurring value |
=,<> |
| MINORITY |
Least frequently occurring value |
=,<> |
| MAXIMUM |
Greatest value |
=,<> |
| MINIMUM |
Smallest value |
=,<> |
| MEAN |
Average value |
=,<>,>,<,>=,<= |
| MEDIAN |
Median value |
=,<>,>,<,>=,<= |
| Table 1. Value-Constrained Functions and Their
Associated Logical Operators |
3.3 Operator Expressions
Flag operators could be described using a command language in a variety
of ways. General expressions for a FOCALFLAG command (Eq. 1.) and a ZONALFLAG
command (Eq. 2.) might be
Equation 1. <output_grid> = FOCALFLAG(<input_grid>, <Window_with_parameters>,
<Function>, <Logical Operator>)
Equation 2. <output_grid> = ZONALFLAG(<value_grid>,<zone_grid>,
<Function>, <Logical Operator>)
The use of a conditional expression generalizes the flag operator, but
as stated earlier, it has yet to be determined if the various potential
combinations are meaningful.
A shorthand notation is used in this paper for describing the MAXIMUM
and MINIMUM flag operators with an equality logical operator. In keeping
with common FOCAL and ZONAL usage, a FOCALFLAGMAX is interpreted as a FOCALFLAG
operator with a MAXIMUM function and an equality logical operator. By the
same token, the ZONALFLAGMAX operator refers to ZONALFLAG operator with
a MAXIMUM function and an equality logical operator.
4. The FOCALFLAGMAX Operator
4.1 Measuring Dominance
The FOCALFLAGMAX operator evaluates the dominance or extent to which a
cell has the greatest value for all the neighborhoods which include it.
(See Figure 4a) As long as a count flag or normalized flag is used, the
result provides a measure of the relative dominance.
a. 5 X 5 Window
|
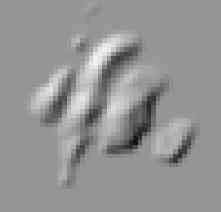
b. Shaded Relief Image
|
Figure 4. FOCALFLAGMAX Results
(Legend) |
It is important to recognize that this measure is not directly correlated
with elevation, because cells with the same elevation may have different
dominance measures, depending on their surrounding elevations. In addition,
it is not the same as flagging a source cell when the source cell is the
maximum value in a window. Here, however, there is an interesting relationship
between flagging the source cell and the FOCALFLAGMAX operator. If a cell
is flagged as the maximum for a 5 X 5 window, it will have the maximum
count of 9 or a normalized flag value of 1.0 for a 3 X 3 window. Flagging
the source cell when it is the maximum is of limited value, however, because
it does not give any information on the relative importance of the source
cell when it does not contain the maximum value. The FOCALFLAGMAX or dominance
measure provides additional insight into the structure of the surface.
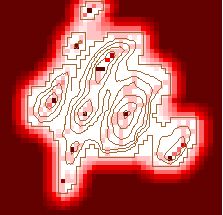
4.2 Revealing Underlying Structure with the FOCALFLAGMAX Operator
The FOCALFLAGMAX operator reveals the underlying structure of the data.
Maximum flag counts or normalized flags with a value of 1.0 indicate peaks
(Figure 5a) or the interiors of large flat areas (Figure 5c). This is because
peaks are greater than or equal to the multivalued cells in neighborhoods
passing through them, while the interiors of flat areas all have the same
value, so they are all equal and have the maximum value. The dual nature
of the maximum values would be a problem for identifying peaks in the data,
if it were not possible to isolate and remove the flat areas. However,
it is possible to remove the flat areas. This is demonstrated by the yellow
flat area mask in Figures 5 a-l.
a. Peaks
|
b. Ridges
|
c. Flat Areas
|
Figure 5. Underlying Structure Revealed by the FOCALFLAGMAX
Operator (5 X 5 Window)
(Legend) |
In addition to the peaks, it is possible to identify significant ridges
(Figure 5b) in the data by examining the intermediate values in the results.
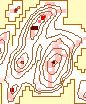
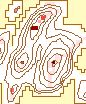
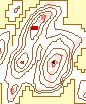
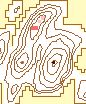
4.3 Effects of Varying the Neighborhood or Analysis Area
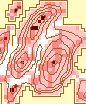
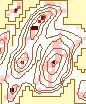
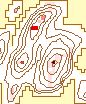
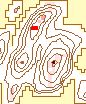
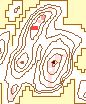
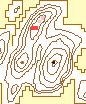
The effects of varying the neighborhood or analysis area can be seen in
Figure 6. The structure of the data arevisible clearly with the smaller
neighborhoods. The ridges can be identified clearly in the 3 X 3 to 7 X
7 windows. Some ridge structure remains visible through the 21 X 21 window,
at which point it disappears. At that point, the remaining information
is limited to the peaks. The number of significant peaks with a normalized
flag value of 1.0 decreases as the window size increases, gradually removing
the less significant peaks.
 |
 |
 |
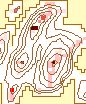 |
| a. 3 X 3 |
b. 5 X 5 |
c. 7 X 7 |
d. 9 X 9 |
 |
 |
 |
 |
| e. 11 X 11 |
f. 13 X 13 |
g. 15 X 15 |
h. 17 X 17 |
 |
 |
 |
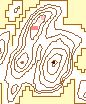 |
| i. 19 X 19 |
j. 21 X 21 |
k. 23 X 23 |
l. 25 X 25 |
| Rectangular Window Size |
Figure 6. Effect of
Changing Window Size
(Legend) |
While Figure 6 uses small multiples (Tufte, 1990) to compare the series
of images, Figure 7 presents the same information in an animated GIF image.
 |
Figure 7. Effects of Changing Window Size
Scale on right shows the window size, i.e., 3 is a 3 X 3 window
(Legend)
|
4.4 Maximum Dominant Window
In addition to evaluating dominance for a single analysis area, it is also
possible to evaluate dominance across analysis areas. This gives rise to
the concept of the maximum dominant window (See Figure 8). The maximum
dominant window is the largest analysis area for which a peak is a maximum.
For example, using the scheme shown in Figure 7, window sizes from 3 X
3 to 25 X 25 are considered for this analysis. Larger windows could be
used, but in this example, a 25 X 25 window is the maximum size.
If a location in a 3 X 3 window has a flag count of 9, meaning it is
the maximum value of all windows passing over it, the location is included
in the maximum dominant window. All other cells are zeroed out. The same
location is evaluated to see if it has a flag count of 25 for a 5 X 5 window.
The location is then evaluated to see if it has a flag count of 49 for
a 7 X 7 window. The process is repeated until the location no longer has
the maximum flag count for the window size. The largest window size for
which the location has a maximum flag count is then stored in the grid.
For display purposes, the grid cells have been converted to points and
displayed as graduated circles, where the circle size is related to the
maximum dominance. The resulting map gives the reader an instant impression
of the relative maximum dominance of different locations.
 |
|
Figure 8. Maximum Dominant Window
|
5. Summary
Flag operators are an important addition to map algebra. By focusing on
WHERE conditions are met, rather than WHAT meets a condition, flag operators
extend spatial analysis capabilities and help reveal the underlying structure
of the data being evaluated. This paper has provided specific examples
of flag operators, as well as a general framework for constructing them.
The FOCALFLAGMAX operator has been described in detail. It measures local
dominance and reveals the underlying structure of the terrain. It is one
of many potential flag operators. Others have yet to be analyzed and explored
to evaluate their potential utility for spatial analysis.
References
Tomlin, C.D. (1990) Geographic information systems and cartographic modelling.
New Jersey, United States: Prentice Hall.
Berry, J.K. (1987) Fundamental operations in computer-assisted map analysis.
International Journal of Geographic Information Systems 2:119-136.
Berry, J.K. (1993a) "Cartographic modeling: The analytic capabilities
of GIS", in Geographic Information Systems and Environmental Modeling,
Oxford, England: Oxford University Press. 58-74.
Berry, J.K. (1993b) Beyond Mapping: Concepts, Algorithms, and Issues
in GIS. Fort Collins, CO: GIS World, Inc.
Berry, J.K. (1995) Spatial Reasoning for Effective GIS. Fort Collins,
CO: GIS World Books.
Tufte, E. (1990) Envisioning Information. Cheshire, CT: Graphics Press.