


The DEM to Mountain Transformation of Zagros Ranges
George Ch. Miliaresis,
Remote Sensing Laboratory, Dept. of Surveying Engineering, National
Technical University Athens, 38 Tripoleos Str., Athens 104-42, Greece.
E-mail: gmiliar@central.ntua.gr
Abstract
The aim of the present research effort is to implement the DEM to Mountain
transformation to Zagros Ranges in Iran, an area of compressional stress.
In order to cope with the specific physiographic conditions evident, the
Mountain to DEM transformation was modified and the valley pixels were
not allowed to participate in the region-growing segmentation process.
More specifically, ridge pixels and valley pixels were labeled on the basis
of their runoff accumulation value. Then an iterative region-growing segmentation
algorithm was applied. During the first iteration, the ridge pixels formed
the initial set of mountain pixels while the rest of the pixels formed
the current set of non-mountain pixels. In each iteration, if a non mountain
pixel satisfied the following three conditions (a) its gradient was >
6o, (b) the pixel was an 8-connected neighbor to the current
set of mountain pixels and (c) it did not belonged to the set of valley
pixels, then it was flagged as a new mountain pixel and the current set
of mountain pixels was updated. The segmentation stopped if no more pixels
were added during the current iteration. Then, small isolated islands of
mountain pixels that represent either mountain remnants or error-peaks
were removed. Additionally, small islands of non-mountain pixels standing
on mountaintops and surrounded by mountain pixels were merged to the mountain
terrain class. The extracted mountain objects were interpreted to be in
accordance to the mountain features interpreted visually from a shaded
relief map of the study area.
1. Introduction
Nowadays, the GTOPO30 digital elevation model (DEM) with spacing 30 arc-seconds
provides a digital representation of the earths relief at a regional scale
(http://edcwww.cr.usgs.gov/landdaac/gtopo30/gtopo30.html.).
The potential of the DEMs to geomorphometric analysis has been already
explained and techniques have being developed in order to automate the
interpretation of terrain related features (Pike, 1995; 1999; Miliaresis
and Argialas, 2000; Miliaresis, 1999a; 1999b; 2000). Towards this end,
a methodology was designed for the extraction of mountains from GTOPO30
DEM (Miliaresis and Argialas, 1999). The methodology was implemented in
a study area of size 82,000 km2 within the Great Basin where
the crust is under tensional forces, thins by normal faulting, and results
in an array of tipped mountain blocks that are separated from broad plain
basins and producing a basin-and-range physiography (Howell, 1995). On
the other hand in Zagros a set of compressional mountain ranges is developed
producing a spectacular mountainous physiography due to the collision of
the Arabian shield with Iran (Summerfield, 1991). The objective of the
present research effort is to implement (and modify, if needed) the DEM
to Mountain transformation to an area of compressional stress such as Zagros
Ranges.
2. Methodology
First the study area and its hypsometric characteristics are introduced.
Then the DEM to Mountain transformation is modified in order to cope with
the specific physiographic conditions evident in Zagros Ranges. Finally
it is implemented and the results are evaluated.
2.1. The study area and the DEM data
The case study was developed for Zagros Ranges (Figure 1) in Iran where
the crust shortens and thickens producing a spectacular mountainous physiography
due to the collision of the Arabian shield with Iran (Summerfield, 1991).
The linear topographic highs represent huge folds (NW-SE anticlines with
steeply dipping flanks), that were formed during the Pliocene-Pleistocene
orogeny and marked by Southwest-facing topographic escarpments (Berberian,
1995). The geometry of anticlines indicates the existence of basement (high
angle) reverse faults that do not cut the overlying folds (Berberian, 1995).
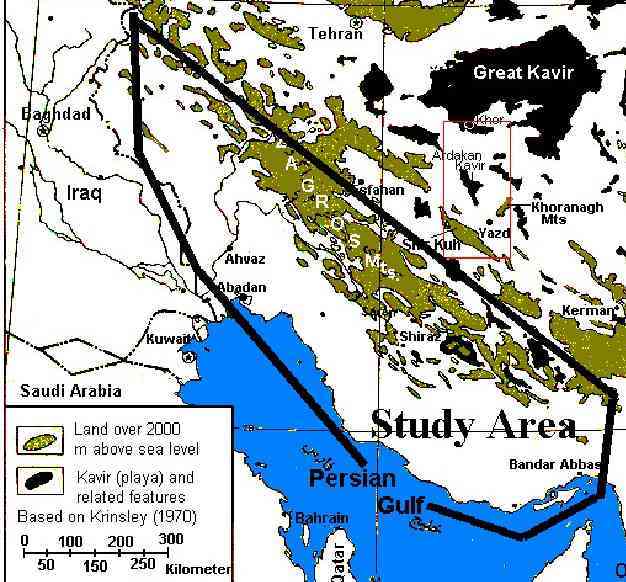
Figure 1. The study area within the Zagros Ranges physiographic zone
(Mehrshahi, 1999).
The GTOPO30 DEM of the study area was rectified to a rectangular grid
with spacing 926 m and occupied 330,000 km2 approximately or
385 775 pixels (Figure 2).
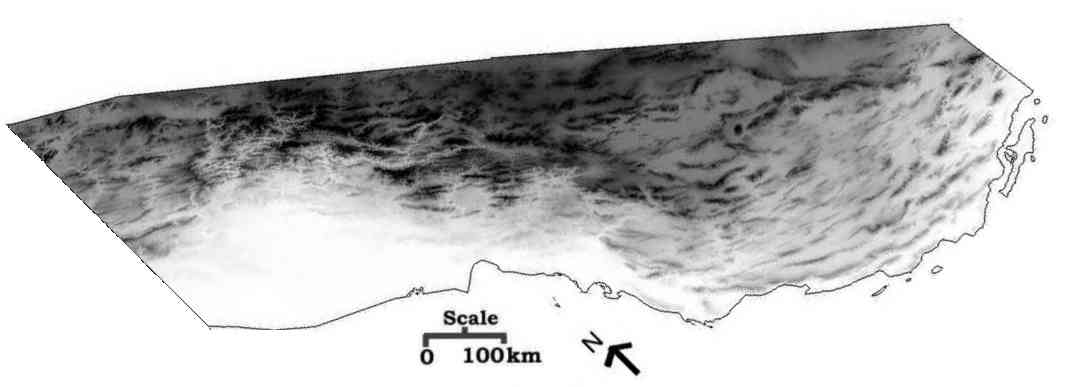
Figure 2. GTOPO30 DEM of the study area. The elevation (1 to 3,000 m)
was rescaled to the interval 255 to 0 (the brightest pixels have lowest
elevation).
The two elevation profiles (Figure 3) indicate that mountain ranges
are built on successively higher baselevels from SE to NW. The The mean
elevation is 1,217.3 m with standard deviation 873.2. The study area is
higher than the mean land level since the present average elevation of
the Earths surface is 780 m above sea level (Howell, 1995).
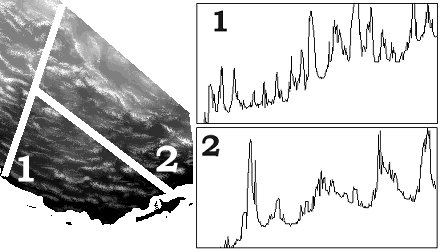
Figure 3. Elevation profiles (1 and 2).
2.2. DEM to Mountain transformation
The DEM to Mountain transformation is actually a region-growing segmentation
algorithm that uses the ridge pixels as seeds and a growing criterion that
is based on gradient (Miliaresis and Argialas, 1999). Thus gradient and
aspect should be computed first. Then the region growing criterion and
the ridge should be defined on the basis of the physiographic and geomorphologic
conditions evident in the study area.
2.2.1 Gradient and aspect computation
The gradient (Figure 4) and the aspect (Figure 5) were computed on the
basis of the Z-operator and the Sobel operator (Miliaresis and Argialas,
1999).
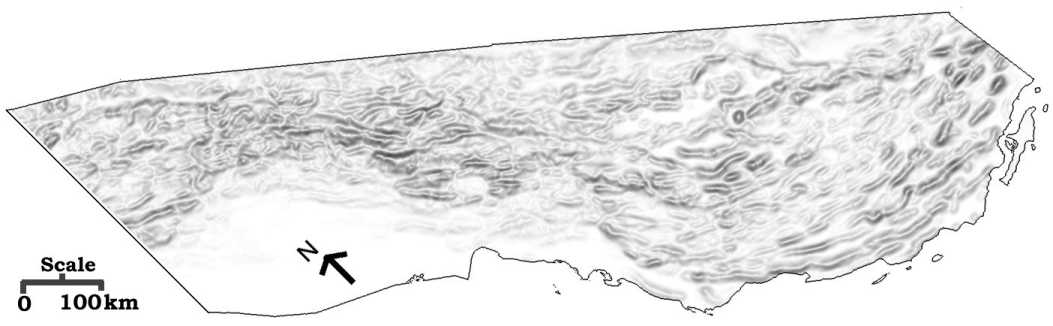
Figure 4. Gradient. The pixels (in the range 0o to 44o)
were rescaled to the interval 255 to 0 (the brightest pixels have lowest
gradient).
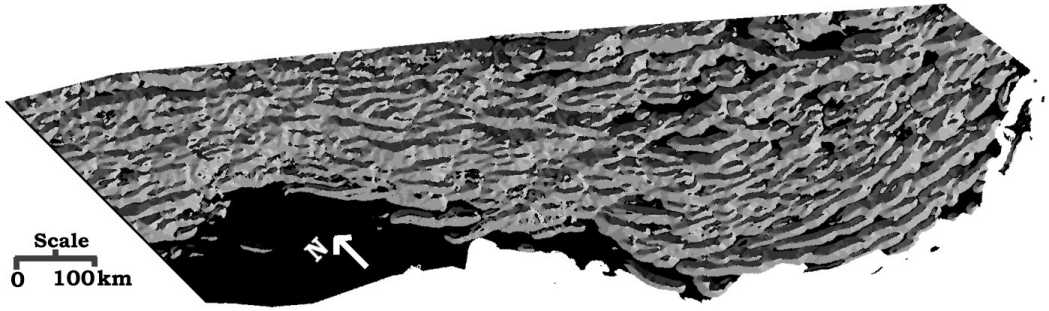
Figure 5. Aspect.The aspect was quantified to the eight directions (East=1,
Northeast=2, North=3, Northwest=4, West=5, Southwest=6, South=7, Southeast=8)
defined in a raster image. Zero labels were used for flat terrain (gradient
< 1o).
2.2.2. Region growing criterion
In the southeast portion of the study area broad gently sloping valleys
are observed in between the mountain features. On the contrary in the northwest
part more tightly spaced mountain features are observed while narrow, deep,
and high sloping valleys are developed in between them. The visual interpretation
of Figures 1b and 2a indicate that the mountaintops are rather flat or
gently sloping in comparison to the rather steep mountainsides. Training
areas statistics indicated that the gradient of mountainsides is greater
than 6o in general. Thus, a region-growing criterion of 6o
degrees would be acceptable (Miliaresis and Argialas, 1999). This is valid
for the southeast potion of the study area (broad gently sloping or flat
valleys are observed in between the mountains). On the contrary in the
northwest part of the study area (narrow deep valleys that slope either
to southeast or to northwest with gradient greater than 6o).
In order to cope with this situation, the DEM to Mountain transformation
was modified and the region growing the valley pixels were not allowed
to participate to the region growing process.
2.2.3. Seeds
In order to proceed the ridge (seeds) and valley pixels (pixels that block
the region growing proces) should be identified. The runoff simulation
algorithm was used and a single water unit was imported in every pixel
of the DEM and traveled in the aspect direction until the edges of the
DEM or a pit was reached (Mark, 1984). The water units imported into each
pixel were counted and the derived values used to represent the pixels
runoff (Mark, 1984). A pixel with high runoff value should be labeled either
as a ridge pixel (upslope flow) or a valley pixel (downslope flow) depending
on the aspect pointing direction. Two thresholds were identified through
a trial and error procedure and the pixels with upslope runoff greater
than 9 were labeled as ridge pixels (Figure 6) while the pixels with downslope
runoff greater than 7 were labeled as valley pixels (Figure 7). A total
of 45,031 (11.67 %) pixels were labeled as ridges and 62,327 (16.15 %)
pixels were labeled as valleys.
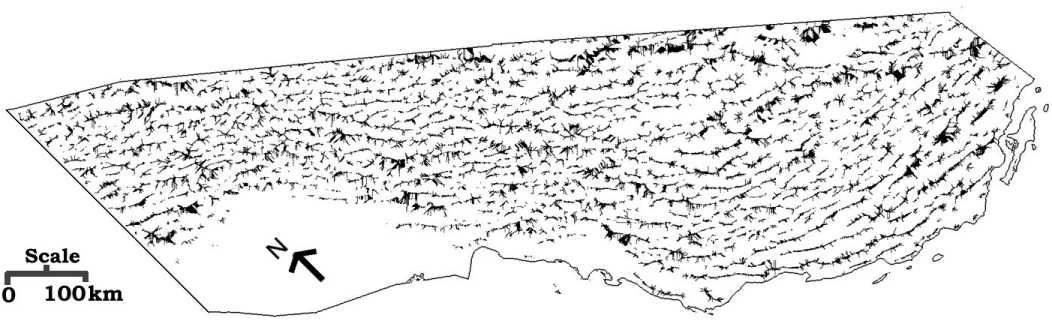
Figure 6. Ridge pixels.
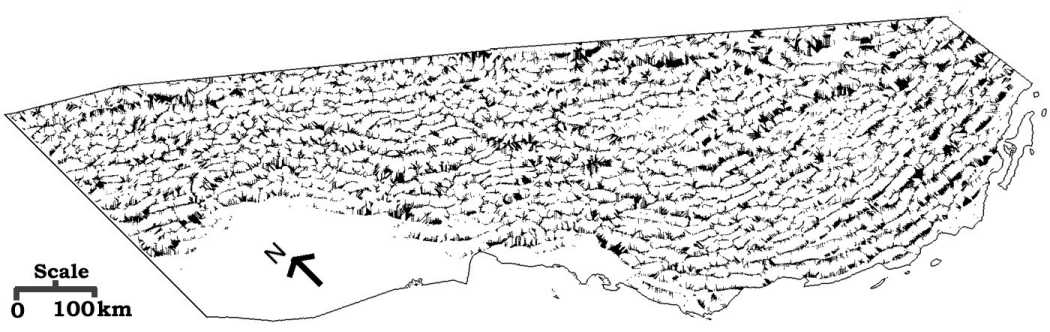
Figure 7. Valley pixels.
2.2.4. Segmentation of mountains
An iterative region growing segmentation was implemented (Pittas, 1993).
The ridge pixels formed the initial set of seeds (the current set of mountain
pixels during the first iteration, while the rest of the pixels formed
the current set of non-mountain pixels). In each iteration, if a non mountain
pixel satisfied the following three conditions (a) its gradient was >
6o, (b) the pixel was an 8-connected neighbor to the current
set of mountain pixels and (c) it was not labeled as a valley pixel, then
it was flagged as a new mountain pixel and the current set of mountain
pixels was updated. Note that the 8-connected neighbors are the 9 pixels
surrounding the central pixel in a kernel 3*3 (Pitas, 1993). The segmentation
stopped if no more pixels were added during the current iteration. Finally,
158,540 (41.01 %) pixels were assigned to the mountain terrain class (Figure
8) after 16 iterations.
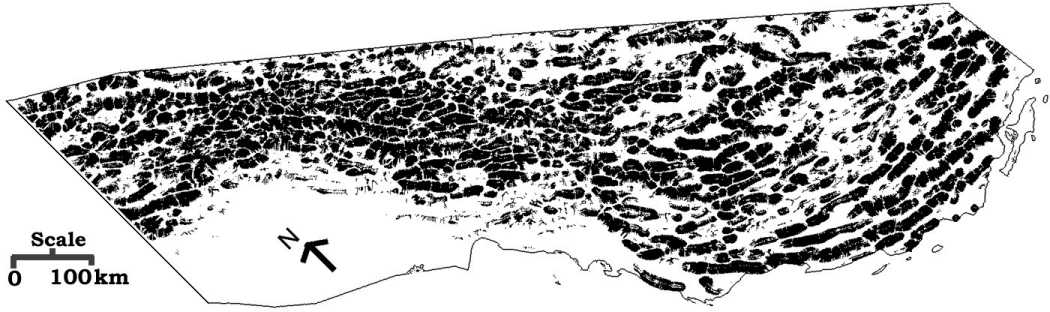
Figure 8. DEM to Mountain transformation. The pixels labeled black represent
the mountain terrain class.
The image of the mountain terrain class is quite noisy. More specifically
very small isolated islands of mountain pixels were observed that represent
either small mountain remnants or artificial error peaks. Additionally
small islands of non-mountain pixels were observed occasionally on mountaintops
and represent flat or gently sloping areas (gradient < 6o).
In order to correct these artifacts, a connected component labeling algorithm
(Pitas, 1993) was applied and both the foreground (mountain terrain class)
and the background objects (non-mountain terrain class) were identified
and their size was calculated. Then the following processing stages were
implemented:
-
The histogram of the size of the foreground objects was studied and the
foreground objects with size smaller than 60 pixels were assigned to the
background (5,217 pixels were removed from the mountain terrain class).
-
The background objects were grouped to two classes. The first one contained
a single object with size 229,631 pixels (black region in Figure 3d) while
the background objects with size less than 40 pixels formed the second
class. The objects of the second class were merged to the mountain terrain
class (2,821 pixels were added) since they were enclosed by pixels of the
mountain terrain class and they should correspond to the mountaintops.
At the end, 156,144 (40.48%) pixels were found to belong to the mountain
terrain class (Figure 9).
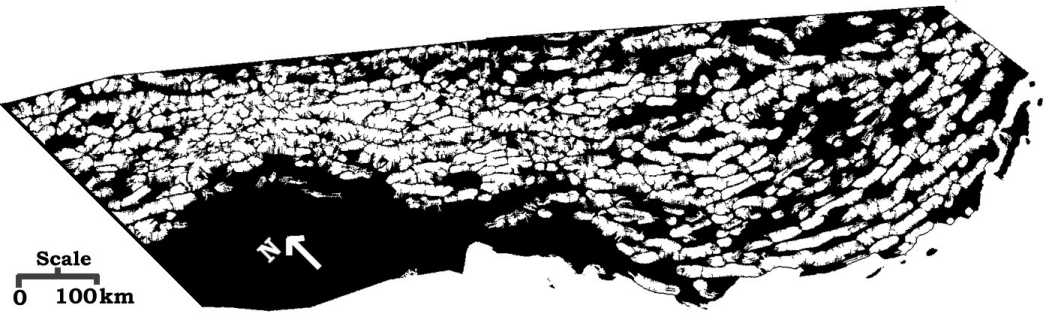
Figure 9.Post-processing of Figure 8. The pixels labeled white within
the study area represent the mountain terrain class.
2.3. Evaluation
The evaluation procedure was based on both the visual interpretation of
the computer-shaded relief map of the study area and statistical data computed
for the mountain and non-mountain terrain classes. Computer shaded-relief
maps are a valuable tool for the computer visualization of landscape morphometry,
allowing the surface features to viewed in a broad regional context (Reichenbach
et al., 1993). The borderlines of the mountain objects were delineated
and superimposed on the shaded-relief map of the DEM of the study area
(Figure 10). Note that the location of the simulated sun was 30o
above the horizon at NW.
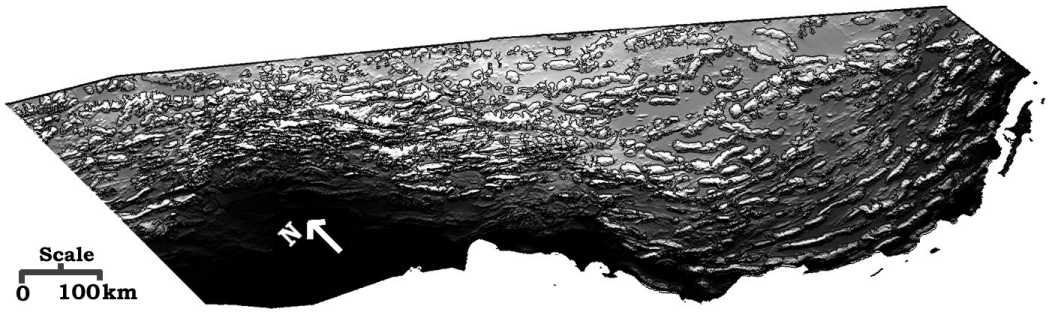
Figure 10. The borderlines (shown black) of the mountains were superimposed
on the shaded- relief map of the study area.
In order to assist the interpretation, a hybrid image was created (Figure
11) and the reflectance of the shaded relief map was shown within the regions
occupied by the mountain objects while the background was depicted white.
It was observed that (a) the majority of the mountain features that were
interpreted from the shaded-relief map, were also extracted by the DEM
to Mountain transformation and (b) the algorithm followed their shape.
Exceptions were some very small mountain objects observed mainly in SW
that were erased during the post-processing stage.
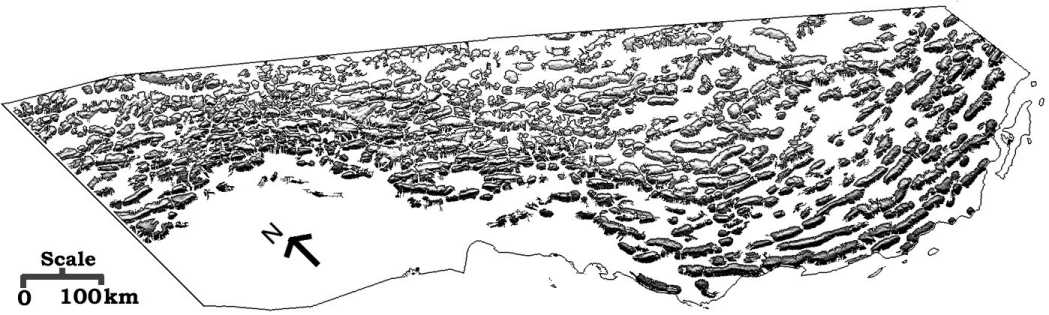
Figure 11. The reflectance of the shaded relief map was depicted within
the mountain objects while the background was depicted white.
3. Concluding comments
The DEM to Mountain transformation was modified in order to cope with the
more tightly spaced mountain objects in the Zagros Ranges continent to
continent coalition morphotectonic context. More specifically region growing
was not allowed for the pixels that were labeled as valley pixels. In the
near future more accurate DEMs of higher spatial resolution will be available
allowing more detailed investigations. For example one could use, digital
terrain data from the Space Shuttle radar interferometric topography mapper
(SRTM). SRTM was designed to acquire digital elevation maps of all regions
of earth surface between 54 S and 60 N latitude with 16 m absolute vertical
height accuracy
.
References
Berberian, M., 1975. Master "Blind Thrust Faults Under the Zagros Folds:
Active Basement Tectonics and Surface Morphotectonics. Tectonophysics,
Vol. 241, pp. 193-224.
Howell, D., 1995. Principles of Terrane Analysis - New Applications
for Global Tectonics, Chapman and Hall, London.
Mark, D., 1984. Automated detection of drainage network
from digital elevation models. Cartographica, Vol. 21, pp. 168-178.
Mehrshahi, Daryoushm, 1999. Iranian Deserts. http://www.geocities.com/CollegePark
/Square/2077/home2.html
Miliaresis, G. and D. Argialas, 1999. Segmentation of Physiographic
Features from the Global Digital Elevation Model/GTOPO30.
Computers
& Geosciences, Vol. 25, No. 7, pp. 715-728.
Miliaresis, G. and D. Argialas, 2000. Extraction and Delineation
of Alluvial Fans from Digital Elevation Models and Landsat Thematic Mapper
Images. Photogrammetric Engineering & Remote Sensing, [ to appear in
August 2000 ]
Miliaresis, G., 1999a. A region-growing algorithm for
the segmentation of alluvial fans from digital elevation models. Proceedings,
1st International Symposium on Imaging Applications in Geology
(GeoVision 99). Liege, Belgium, pp. 189-192.
Miliaresis, G., 1999b. Automated segmentation of alluvial
fans to regions of high to intermediate flood hazard from Landsat Thematic
Mapper imagery. Proceedings, 2nd International Symposium on
Operationalization of Remote Sensing. Enschede-ITC, The Netherlands, (6
pp.).
Miliaresis G., 2000. Segmentation of Alluvial Aprons from
the USGS Digital Elevation Models with Spacing 2-Arc Seconds. Proceedings,
RGS-IBG 2000, Session on Surface Modeling in Geography, Sussex, (U.K.)
January 4-7.
Pike, R., 1995. Geomorphometry-Process, Practice and Prospects.
Zeitshcrift
f. Geomorphologie N.F. suppl. Bd., Vol. 101, pp. 221-238.
Pike, R., 1999. A Bibliography of Geomorphometry, the Quantitative
Representation of Topography-Supplement 3 (Open-File Report 99-140),
U.S. Geological Survey, Menlo Park.
Pitas, I., 1993. Digital image processing algorithms,
Prentice Hall, London.
Reichenbach, P., R. Pike, W. Acevedo and R. Mark, 1993.
A new landform map of Italy in computer-shaded relief.
Anno LII - Bolletino
Di Geodesia E Scienze Affini, Vol. 1, pp. 21-44.
Summerfield, M., 1991. Global Geomorphology, Longman Group, Essex.