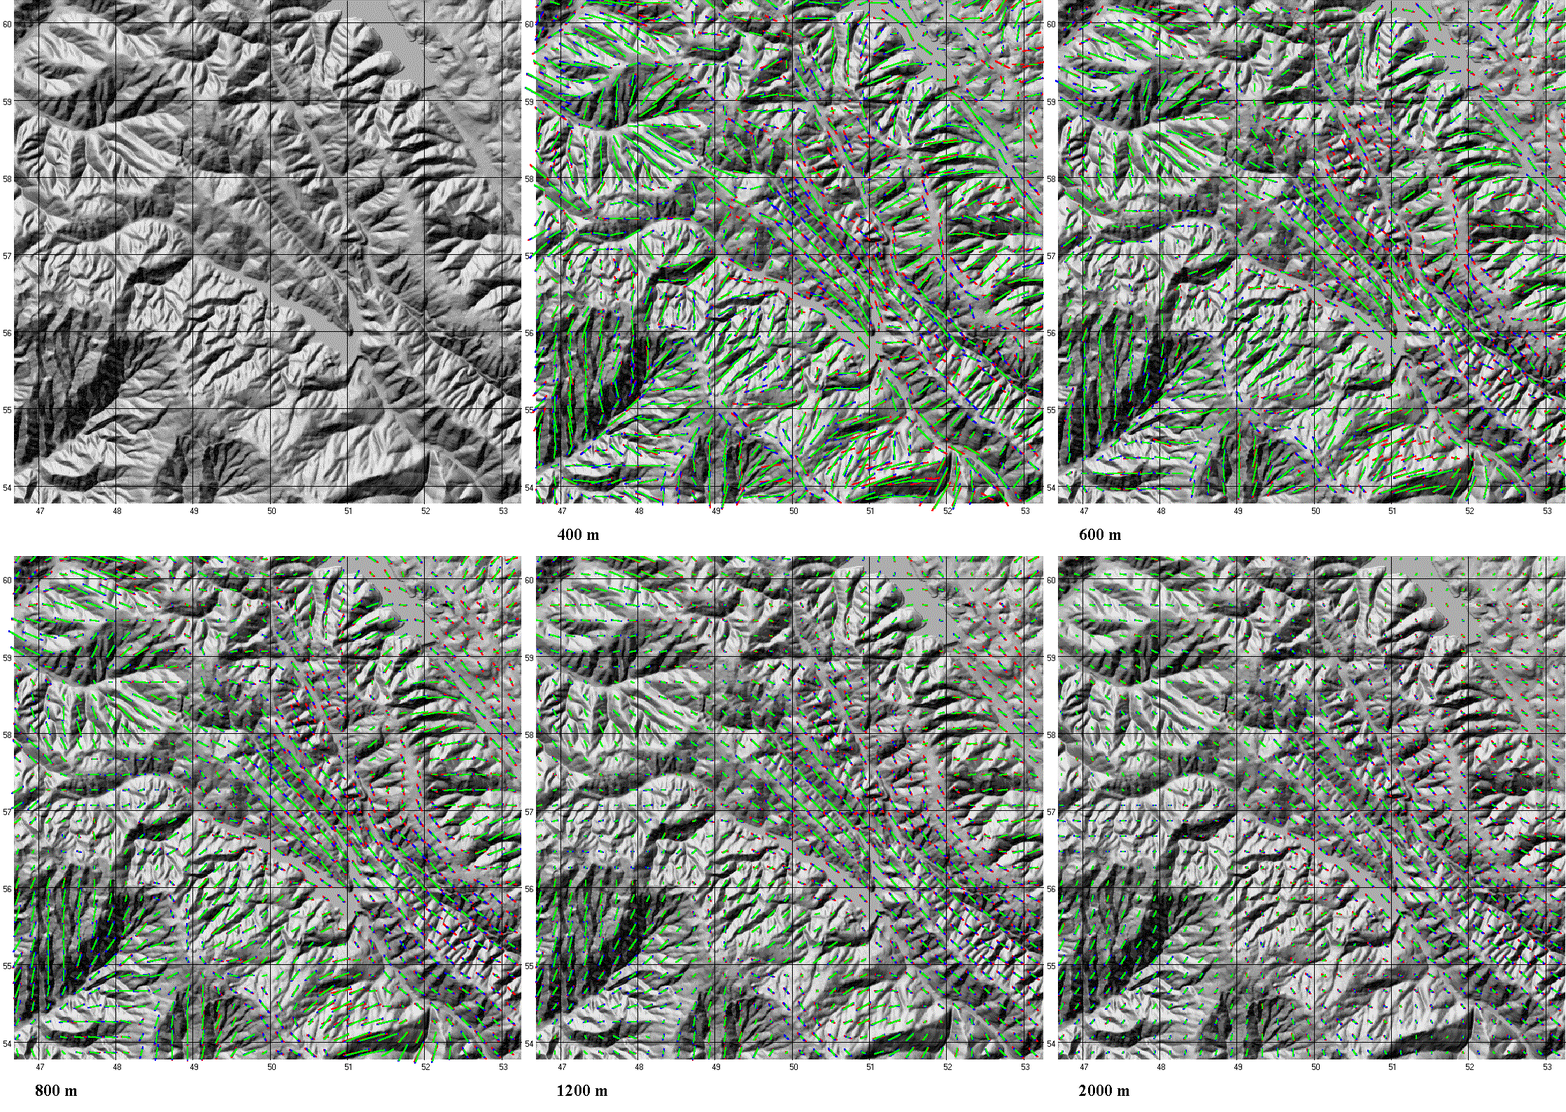
Fabric Overlays on a Single Base Map
All maps show the fabric computed every 200 m.
The color scheme for the overlays:
Red, 30 m Level 1 DEM (drawn first)
Blue, 30 m Level 2 DEM
Green, 10 m Level 2 DEM (drawn last)
Portion of the Montara Mountain, California quadrangle. The animation shows the effect of varying the region size.
Note that different parts of the map show different color patterns. The west side has almost none of the red (Level 1) fabric showing, showing that it generally agrees very closely with the other two DEMs. The level 1 DEM shows much greater differences on the eastern half of the map. The blue and green (the two Level 2 DEMs) generally have the same orientation, but the 30 m DEM often has a slightly stronger organization parameter. The largest differences in orientation generally occur where the strength of the fabric is smallest.
Portion of the Mount Jackson, Wyoming, quadrangle. Region size is 800 m.
The three DEMs generally agree very well.
Portion of the Astoria, Oregon, quadrangle. Region size is 800 m.
The Level 1 DEM in red disagrees with the other two most significantly in the flatter regions.