
 |
Return to GeoComputation 99 Index
David R. Legates
Southern Regional Climate Center, Louisiana State University, Baton Rouge, Louisiana 70803-2541 U.S.A.
Email: legates@bayamo.srcc.lsu.edu
Kenneth R. Nixon, Geoffrey E. Quelch, and Thomas D. Stockdale
Computational Geosciences, Inc., Norman, Oklahoma 73069 USA
Surface observations have usually been the sole source of meteorological data for environmental modeling and monitoring applications. Development of a national network of Doppler weather radars, coupled with advances in GIS methodology and sophisticated spatial interpolation techniques, now has provided improved, high-resolution weather data for use in a new generation of distributed (grid-based) environmental models. The High-Resolution Weather Data System (HRWxDS) is a real-time, site-specific, operational system that couples this new weather information with surface observations, hydrological modeling, and an interface to facilitate more informed decision-making tasks. Spatially and temporally distributed meteorological and hydrological fields produced by the HRWxDS include precipitation (radar-based, gage-based, and a composite gage-radar product), wind velocity (speed and direction), air temperature, atmospheric humidity and pressure, and solar radiation. Derived fields include maximum and minimum daily air temperature, relative humidity, and storm total precipitation. Both digital and graphical products are produced that can be used for monitoring and analyzing meteorological and hydrological conditions for a particular location or region.
This system is designed to improve site-specific water resource management for a variety of purposes including river management for optimal hydroelectric power generation, soil moisture monitoring for optimal irrigation scheduling or for wildfire prediction, wind (speed and direction) estimation for pesticide drift applications, and rainfall/flood monitoring for enhanced emergency management. Presently, the HRWxDS and its components have been used in a wide variety of applications. For example, it operates as the front-end of a river management system that models the real-time water flow for the Catawba River Basin in North Carolina (by Duke Energy Corporation) and has been successfully applied to assess the spatial and temporal distribution of rainfall for several flooding events in Texas. Applications of irrigation scheduling and pesticide drift in southwestern Oklahoma also are being developed.
Surface observations usually provide the meteorological inputs for most environmental modeling applications. With the advent of Doppler weather radar and sophisticated spatial interpolation techniques, however, improved high-resolution data now can be used to provide meteorological data to a new generation of distributed (i.e., grid-based) environmental models. The High-Resolution Weather Data System (HRWxDS) is a real-time/historical system that provides high-resolution, spatially distributed, digital data products for operational use. Products generated by the HRWxDS can be incorporated into hydrological or other environmental models. The HRWxDS also produces graphical products that can be used for monitoring and analyzing meteorological conditions for a particular location or a large region.
Data streams ingested by the HRWxDS include precipitation data from the new generation of weather radars (WSR-88Ds) and weather information from high spatial resolution data networks (e.g., ASOS) that recently have been developed as a result of National Weather Service (NWS) modernization programs and other agencies with innovative weather data foci. Rather than simply providing end-users with "raw" meteorological data, the HRWxDS supplies decision makers with improved meteorological information that can be easily input to hydrologic models, presented and further analyzed as geographic information system (GIS) overlays, or evaluated graphically. Consequently, the HRWxDS is a decision support tool that transforms weather data into weather information and enables end-users to realize the benefits and values of these technological advances and deployment programs (Figure 1). Specific applications of the HRWxDS include providing hydrometeorological input for a river management system to optimize hydroelectric power generation and reservoir levels, high spatial resolution monitoring of fire potential and drought conditions over large areas, irrigation scheduling applications in agriculture, and emergency water resource management (e.g., floods). The HRWxDS has been used in a wide variety of such applications (Nixon et al., 1994; Legates et al., 1996) and presently operates as the front-end of a river management system for real-time modeling of the Catawba River Basin in North Carolina by Duke Energy Corporation.

Figure 1: Data-Information-Value Schematic.
The HRWxDS was software engineered using the latest software development methodologies (e.g., code inspections). As a spatial tool, it incorporates GIS tools and its products can be easily input to commercial GIS packages for further analysis and presentation. It was written in a combination of Motif (GUI), C, and FORTRAN (product processing) and uses a modular, extendible architecture to allow it to be able to easily accommodate the development of new products and incorporate new algorithms. Its research extends from a successful technology transfer project that first began in the Center for Computational Geosciences at the University of Oklahoma.
The HRWxDS consists of five major subsystems -- the Setup and Processing Control GUI Subsystem, the Data Acquisition Subsystem, the Product Processing Component (PPC), the Event Logging Facility (ELF), and the Decision Support and Display Subsystem (Figure 2). Each of these subsystems is designed to provide flexibility in the overall system so it can be easily customized for specialized applications.
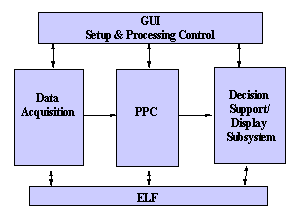
Figure 2: The five major subsystems of the HRWxDS.
The Setup and Processing Control GUI Subsystem is a graphical user interface that tailors the data acquisition and processing to the demands of the application. This component performs system initialization, process control, and a graceful system shutdown in the event of an unrecoverable error. Several user-adaptable features are provided through the GUI subsystem.
First, the GUI allows for geographic region definition. The HRWxDS can be easily configured to provide information for a specific geographic region ranging in size from a large portion of the country encompassing several states to a small river basin of less than 100 km2. Multiple regions also can be defined and the HRWxDS can switch from region to region without the need to restart the system.
This subsystem also allows the user to select the radars and surface observing stations that are to be used in product generation. Radars and stations can be dynamically added or deleted. In addition, the HRWxDS can incorporate surface data from national or local/private mesonetworks, or both. A complete list of NWS radars and first-order weather stations is provided. The user also can provide and/or change information on the station metadata file (e.g., information on the location of the station, design of the raingage, and the height of the raingage and anemometer above the ground).
A set of "processing control knobs" is used to adjust or fine tune the processing to the specific application and set the processing to match characteristics of specific precipitation events. A discussion of some of these knobs is given in Section 3. One knob controls the mode of operation -- the user can select from "Attended," "Unattended," or "Historical" modes. In "Attended" mode, the user has the capability to dynamically interact with the processing and handle exception conditions as they occur. In "Unattended" mode, the system will select from predetermined responses to handle anticipated operational exceptions. "Historical" mode is used to update the system during power outages or network failures or to analyze significant hydrometeorological events after they occur for areas where the HRWxDS was not operating in real-time. Controls also are provided for setting the start time and processing interval, time tolerances for data alignment, and selection of products of interest.
WSR-88D weather radar data (specifically, the Digital Precipitation Array or DPA) and surface observational data are obtained through the Data Acquisition Subsystem. It handles the necessary chores of obtaining WSR-88D radar and surface observation data in real time by keeping track of their physical location (e.g., on disk, across a network via ftp, or dial-up data access) and signaling the GUI when data outages are detected.
The PPC produces gridded meteorological products, including radar-based, raingage-based, and composite gage-radar precipitation estimates, air temperature, dew point temperature, wind speed and direction, atmospheric pressure, and solar radiation; thus, the PPC is the scientific component of the HRWxDS. A more complete discussion of the science of the HRWxDS is given in Section 3.
All significant processing events are documented by the Event Logging Facility (ELF). The ELF is a central facility for the HRWxDS that tracks all events of which the user may need to be made aware. Event logging may be sent to a file on disk and/or an on-screen dialog box. The facility provides for nine different events: Information, Minor Error, Major Error, Fatal Error, Minor Operating System Error, Major Operating System Error, Fatal Operating System Error, Memory Usage Event, and Disk Usage Event. An important aspect of the ELF is its ability to display a graphical dialog box on the user interface such that the user can be aware that a specific event occurred. This allows the user to respond appropriately to the event. In unattended mode of operation, fatal errors will cause the HRWxDS to shut down gracefully (hopefully) and attempt to restart itself.
Routines to display all products produced by the HRWxDS are provided by the Decision Support and Display Subsystem. From these displays, the gridded meteorological products can be analyzed directly or be tailored to form an application-specific user decision support system. Through control knobs in the GUI, the user can select the measurement units (English or metric), a fixed or variable scale color bar, and display-scale thresholds. The overlay feature provides the capability to display radar or station observation locations, watershed delineations, grid mesh, political boundaries, hydrography (e.g., rivers, streams, and lakes), major roads, or other user-selected overlay combinations. An animation capability also is provided to display a time-series of products for visual representation of how meteorological conditions are changing. In addition, individual cell values can be determined by simply moving the mouse over the cell(s) of interest. Latitude and longitude of the center of the cell are displayed along with the cell's value for the currently displayed product.
The Product Processing Component of the HRWxDS is responsible for calibrating the radar precipitation estimates and spatially interpolating the station data to a grid. Three precipitation products are produced -- a "gage-only" product computed by spatially interpolating the raingage data, a "radar-only" product computed as a mosaic of the radar DPA data, and a "composite gage-radar" product that calibrates the DPA using the gage observations. In addition, gridded fields of air temperature, dew point temperature, wind speed and direction, sea-level pressure, and solar radiation are present. The time period for each of these products is hourly, although the user may change the time step if necessary.
From these basic products, several derived products are generated. These include the "composite minus radar" precipitation (computed as a difference from the composite gage-radar and radar-only precipitation products), the "composite minus gage" precipitation (computed as a difference from the composite gage-radar and gage-only precipitation products), relative humidity, daily precipitation total and storm total precipitation (from the composite gage-radar product), and maximum and minimum daily air temperature.
Spatial resolution of the radar DPA is approximately 4km x 4km resolution and defined by the Hydrological Rainfall Analysis Project (HRAP) grid. For consistency of overlay, all non radar-based fields are interpolated to the nodes of these HRAP grid intersections.
For the spatial interpolation to the HRAP grid resolution, the algorithm used is an adaptation of Shepard's (1968) distance-based interpolation method. Enhancements suggested by Willmott et al. (1985) as well as additional interpolation adjustments have been incorporated. The general interpolated estimate of the field, Z(q, l), at latitude q and longitude l can be written as

where the interpolated value is a function of the elevation effect term, Z’(r) (see below), the N observed values of Z(qi, li), the weights for each observation, Wi, and an extrapolation parameter, DZi. Observational weights are computed from

where Dj is the distance between the interpolate point and the observed point, j, aij is the angle formed between the observed points, i and j, with the interpolate point as the vertex (to account for the angular distribution of data around the interpolate point), b is the calibration exponent (see next section) and Si is the distance weighting function given by

where D* is the user-specified radius of influence for the given field to be interpolated. The extrapolation parameter, DZi, is used to provide for the estimation of peaks and valleys beyond the limits of the observed data. The extrapolation parameter is given by
![]()
where the directional derivatives of the field, ¶Z/¶q and ¶Z/¶l, are evaluated at each observed point and the extrapolation constant, n, equals

Based on the recommendations of Willmott et al. (1985), the calculation of distance, direction, and spatial gradients are made using spherical coordinates and spherical trigonometry. This is done to ensure that in large-scale spatial applications, the effect of earth curvature is properly taken into account.
If no points lie within the influence radius, D*, then Z(q, l) is set to missing whereas if only a single point, Z(qi, li), lies within the influence radius, then Z(q, l) = Z’(r) + Z(qi, li). Moreover, if a station lies within 100 meters of the center of the HRAP cell, then Z(q, l) = Z’(r) + Z(qi, li) for that station to prevent Di from becoming zero.
The elevational effect term, Z’(r), is computed as a simple linear relationship between the value of the field and elevation; that is,
![]()
where r is the elevation of the HRAP cell and the parameters, EI and ES are the intercept and slope for the linear least squares estimation of interpolation based on station elevation.
An exception to this elevational effect procedure occurs with air temperature and, subsequently, dew point temperature. Station air temperatures are converted to pseudo sea-level equivalents using the average environmental lapse rate of 0.007oC m-1. These pseudo equivalent sea-level air temperatures are then interpolated using the above equations (the inclusion of elevation effects through the previous equation adjusts for observed differences in the vertical lapse rates from 0.007oC m-1) to produce a pseudo equivalent sea-level air temperature field estimate. This estimate is then returned to the HRAP grid elevations through a temperature decrease with height according to 0.007oC m-1. If the resulting surface air temperature is less than the interpolated dew point temperature, the temperature decrease with height continues at the environmental lapse rate until saturation occurs, then proceeds at the wet adiabatic lapse rate until the surface elevation is reached. The wet adiabatic lapse rate, Gw, is computed from
![]()
where G is the acceleration due to gravity, Cp is the specific heat of air at constant pressure, L is the latent heat of vaporization, and d is the slope of the saturation vapor pressure versus air temperature curve. All parameters are expressed as a function of the saturated moisture content of the air as well as elevation, where appropriate.
Calibration of several parameters, based on the observed data, is allowed by the PPC. The interpolation exponent, b, and the parameters that define the effect of elevational gradients, EI and ES, can be optimally determined from the observations. Optionally the user may select defaults for these parameters without calibration -- the default value of b is 2.0 and the default value of the elevational gradient parameters is 0.0.
Optimization of these parameters is specified to minimize the mean absolute error (MAE) of the interpolation. Determination of the optimal value of b is made through a jackknife approach whereby estimates of the field are made at sites were observations exist using the other observations and withholding the observation at the interpolate location. The parameters for the elevational gradient estimation are made on the basis of the method of least squares since it will produce estimates that are best linear unbiased estimators (BLUE). In addition to the efficiency of the estimators, a conservative measure of the efficacy of the interpolation is provided (minimized MAE). This measure is considered to be "conservative" in that the intra-station distances are larger than the average distance between the observations and the point to be interpolated.
A preponderance of zero values, such as is often the case with gage-measured precipitation, usually results in a precipitation measurement at a single station producing non-zero precipitation estimates for all cells within D* of that station, even if other station measurements of zero precipitation occurred within that same radius. To compensate, precipitation measurements of no precipitation were augmented to negative values to offset the adverse effect of non-zero (positive) precipitation measurements. Specifically, each precipitation measurement is adjusted by
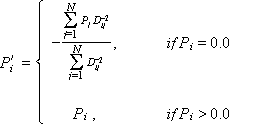
where P’i is the adjusted precipitation value and Dij is the distance between observations i and j; thus, station measurements with non-zero (positive) precipitation totals are unaffected. By contrast, station measurements of no precipitation are replaced by non-positive values to offset the possible adverse influence that positive precipitation estimates would have on cells where an observation of no precipitation is closer to the interpolate cell than an observation of non-zero precipitation.
Since hourly average wind is a vector quantity (speed and direction), it is interpolated differently. First, the logarithmic wind profile is used to adjust the wind measurements to a standard height of 10 meters. Wind measurements are then decomposed into north-south and east-west wind components and each component is interpolated separately. These two components are then recombined at each HRAP grid cell to produce a resultant average vector where the wind speed is defined as the magnitude of this vector and the direction is the arc tangent of the ratio of the east-west component to the north-south component. When the wind speed becomes zero, the wind direction is meaningless.
Gage bias adjustments are performed to account for the deleterious effects of the precipitation measurement process. These bias adjustments are a function of the wind speed, the gage orifice height, gage type, degree of gage sheltering, and the type of precipitation (rain or snow -- determined from the air temperature) and almost always result in a biased underestimate of precipitation. For rainfall, the bias adjustment results in an increase of only about 5 to 6 percent, whereas snowfall measurements may be increased substantially and increases of more than thirty percent are possible. In general, the bias adjustments increase (1) as wind speed and gage orifice height increase, (2) as the gage sheltering decreases, (3) if a wind shield is not used, and (4) for snowfall events. If the user desires, gage measurements may not be adjusted for gage measurement biases although bias adjustment is the default. For a more complete discussion of gage measurement biases, the reader is urged to consult Legates and DeLiberty (1993a,b) and Groisman and Legates (1994; 1995).
The advantage of weather radar is that it has a much-improved spatial resolution over virtually all but the smallest-scale observing networks; thus, one of the main innovations of the HRWxDS is the use of weather radar to provide the spatial "footprint" of the storm with gage observations to calibrate the radar information for a higher degree of accuracy. The "composite gage-radar" product is unique to the HRWxDS.
Many studies have demonstrated that the WSR-88D weather radars underestimate precipitation during heavy rainfall events (e.g., convective showers and tropical storm events) by as much as a factor of two or three (see Legates, 1999). The advantage of radars is that they can provide a high-resolution representation of the spatial distribution of precipitation. By contrast, gage data, when adjusted for gage measurement biases, represent relatively accurate point estimates of precipitation, although most gage networks are inadequate to resolve the spatial character of storm precipitation. To exploit the advantages of both the radar estimates and gage measurements, the radar-gage composite product uses the radar DPA to provide the spatial "footprint" of the storm while gage data are used to calibrate the radar estimate. Consequently, this provides a more accurate, higher-resolution precipitation field than can be afforded by the use of gages or radar estimates alone. Since the HRWxDS is a real-time system, it can only be based on the DPA that is available in real-time. Raw reflectivities, radial velocities, and spectrum width are available from the radar but, owing to their enormous size, this information is not generally transmitted for real-time use outside the National Weather Service. A complete discussion of the NWS processing of the DPA is beyond the scope of this paper. For more information, the reader is urged to consult Fulton et al. (1998).
The WSR-88D is a microwave weather radar operating at nominally 10cm wavelength. Microwave energy is highly reflective from liquid and solid hydrometeors while being relatively transparent to water vapor. Consequently, the returned power (reflectivity) to the radar can be used as an estimate of the condensed moisture present in the atmosphere. The delay between the time the pulse of energy is emitted and the reflectivity is received by the radar is a measure of its distance from the radar. Please consult Doviak and Zrnic (1992).
Considerable uncertainty exists in precipitation estimates from the WSR-88D weather radars as a result of three main sources of error: errors associated with measuring reflectivity, errors associated with the reflectivity-to-rainfall (Z-R) relationship, and errors associated with below beam effects. Accurate measurements of reflectivity are affected by (1) ground clutter and anomalous propagation (both resulting from reflectivity from ground objects), which tend to overestimate precipitation, (2) partial beam filling (the radar beam widens with distance from the radar), attenuation through intervening precipitation, and wet radome attenuation, which tends to underestimate precipitation, and (3) improper hardware calibrating which tends to be unsystematic. The WSR-88D system is generally self-calibrating so that hardware drift should be minimized. Further, its preprocessing algorithm takes specific steps to limit ground clutter and anomalous propagation influences.
Unfortunately, precipitation is a function of the cube of the droplet diameter (volume) but reflectivity depends on the sixth power. Consequently, the conversion from reflectivity (Z) to rainfall (R) is not a one-to-one correspondence so that a distribution of droplet sizes must be assumed which, in turn, leads to uncertainties in precipitation estimation. Reflectivity also varies by hydrometeor type (liquid versus solid) so that hail, snow, and mixed precipitation events can adversely affect the Z-R relationship.
As the distance from the radar increases, the radar beam elevation above ground increases as well. As a result, strong horizontal winds, evaporation of falling precipitation (virga), and collision/coalescence below the radar beam can lead to uncertainties in radar-based estimates of precipitation. For a more thorough discussion of problems in estimating precipitation from weather radars, the reader should consult Doviak and Zrnic (1992), Fulton et al. (1998), or Legates (1999).
Calibration of the radar DPAs using the gage measurements is based on several premises. First, each radar is treated separately for calibration purposes since it is assumed that biases may vary substantially from radar to radar. To convert from reflectivity to rainfall rate, the WSR-88D algorithms generally use Z = 300 R1.4 although Z = 250 R1.2 has been approved for use at some stations, predominantly in areas frequented by convective precipitation. The first step in the generation of the composite gage-radar product is to apply the appropriate equation to convert the DPA back from rainfall rate estimates to an "effective reflectivity." Then, gage-radar pairs -- pairs where non-zero precipitation is recorded by a raingage in a HRAP cell for which a significant reflectivity has been recorded -- are defined. These pairs may come from the current time integration of the HRWxDS or from previous hours. The user can determine the lifetime of these pairs in the HRWxDS.
From the gage-radar pairs, recalibration of the Z-R relationship is performed. The adjusted rainfall rate, R, is computed from the effective reflectivity, Z', using the following schedule based on the number of gage-radar pairs available:
|
If more than 6 gage-radar pairs exist, then |
Z' = a Rb Dc |
|
If 5 or 6 gage-radar pairs exist, then |
Z' = a Rb |
|
If 3 or 4 gage-radar pairs exist, then |
Z' = a R or Rb |
|
If less than 3 gage-radar pairs exist, then |
Z' = 300 R1.4 or 250 R1.2 |
where D is the distance from the radar and a, b, and c are calibration constants. Distance is included as a variable since many error sources increase with increasing distance (e.g., partial beam filling, anomalous propagation, attenuation through intervening rainfall). The rationale for this schedule is to provide at least two degrees of freedom per coefficient for each parameter; therefore, an estimate of the calibration accuracy can be made. Note that for nearly all cases, a sufficient number of gage-radar pairs will be obtained so that item d will always be the equation of first choice. The form of this equation is similar to the standard Z-R relationship of Z = a Rb so that it can be "reversed" and effectively respecified. In all cases, an assessment of the accuracy of the equation is made and if a user-specified error tolerance (10 mm hr-1 default) is not met, then the next simpler equation (fewer parameters) is tried. For the one-parameter calibration, the equation with the lower mean absolute error is used. A user-specified cap also is enforced so that calibrated estimates are not changed by more than a predefined amount.
As hail contamination (bright banding) is a particular problem with radar precipitation estimates, two specific checks are made. First, rainfall rates that exceed a predefined value (absolute hail check) are flagged. The default value is 144.3 mm hr-1 (from the WSR-88D system) although the user has the option of changing this default value. Next, rainfall rates in adjacent cells that differ by more than a predefined value (relative hail checks) also are flagged. Cells that suddenly increase in reflectivity characterize hail contamination. The default value is 76.2 mm hr-1 although, again, the user may change this value. Note that a tropical storm knob is provided to override these hail contamination determinations in cases where excessively heavy rainfall is expected to occur (e.g., during a tropical storm or hurricane landfall).
If either of these two conditions (absolute or relative hail checks) are flagged, the radar rainfall for the cell is set to the missing value, interpolated from surrounding stations, or replaced by the gage-only precipitation estimate, depending on the user’s specifications. Such checks, coupled with the precautions taken by the WSR-88D system processing, should adjust specifically for solid hydrometeor contamination.
The calibrated radar DPAs then are merged to form the "composite gage-radar" product. Calibrated radar mosaics are produced by selecting the maximum precipitation (or alternatively, averaging) for HRAP cells in which an overlapping coverage exists for multiple radars. If the radar reports no precipitation for the entire coverage area, its adjusted values are set to zero and the processing skips to the next radar. Note that the "radar-only" precipitation mosaic also is obtained by selecting the maximum precipitation (or alternatively, averaging) for HRAP cells for which an overlapping coverage exists for multiple radars; however no calibration of the DPAs are performed for this product.
The HRWxDS allows for user-specified "effective" raingages. Through this process, the composite gage-radar precipitation product can be manipulated by the user and additional non-standard precipitation estimates can be incorporated. These additional estimates may originate from temporary field sites and studies or from irregular reporting sources; moreover, the effective raingage system also allows the user to manually adjust for problems in the composite product during attended mode of operation.
Three types of effective raingages exist, based on whether their value is positive, zero, or negative. If an effective raingage is given a positive value, it functions exactly like a precipitation gage; that is, its value is treated just like a measurement from the standard public and/or private raingage inputs. The radius of influence is exactly the same as all other gages and in all cases, a positive effective raingage is treated like any other raingage measurement. Negative values for an effective raingage are assumed to be snowfall totals. An additional parameter is specified to convert from snowfall depth to liquid water equivalent. Default values are a 10:1 ratio (ten millimeters of snow equals one millimeter of liquid water) but can be changed from 7:1 to 14:1 at the user’s discretion. Once converted to liquid water equivalents, a negative value for an effective raingage functions exactly the same as any other raingage measurement. Zero values for an effective raingage are used to provide manual adjustment for clutter suppression and virga detection. In some of our analyses, we have noted the DPAs may contain small areas of ground clutter or large areas of erroneous precipitation. These events are difficult to detect programmatically, but the user can remove these areas by specifying an effective raingage with zero precipitation and a radius of precipitation suppression.
This paper is intended to focus on the HRWxDS system and not provide detailed information about radar calibration procedures. Legates (1999) and Legates et al. (1999) provide more information about the science in the HRWxDS.
To provide an overview of the products produced by the HRWxDS, a brief example is given. On September 25-26, 1996, a cold front moved swiftly across Oklahoma from the northwest to the southeast. At that time, the HRWxDS was processing data in unattended mode. The following hourly graphical images were obtained from that event from 1:03 GMT (8:03PM CDT on September 25) to 22:03 GMT (17:00PM CDT on September 26). Precipitation data represent the rainfall for the previous hour while the other fields represent the measurements taken at the top of each hour. Note that the purpose of the HRWxDS was to produce the high spatial resolution hydrometeorological estimates from which the system generated these images. The graphics are neither the only, nor the most important, end product.
Precipitation estimates from the "gage-only" (Figure 3), "radar-only" (Figure 4), and "composite gage-radar" (Figure 5) products are shown. From the gage-only product, it is clear that the station network (augmented here by the Oklahoma Mesonet -- a network of 111 real-time surface observation sites) is unable to adequately resolve the true spatial fidelity of the storm. Both the radar-only and the composite gage-radar products exhibit much more spatial fidelity.
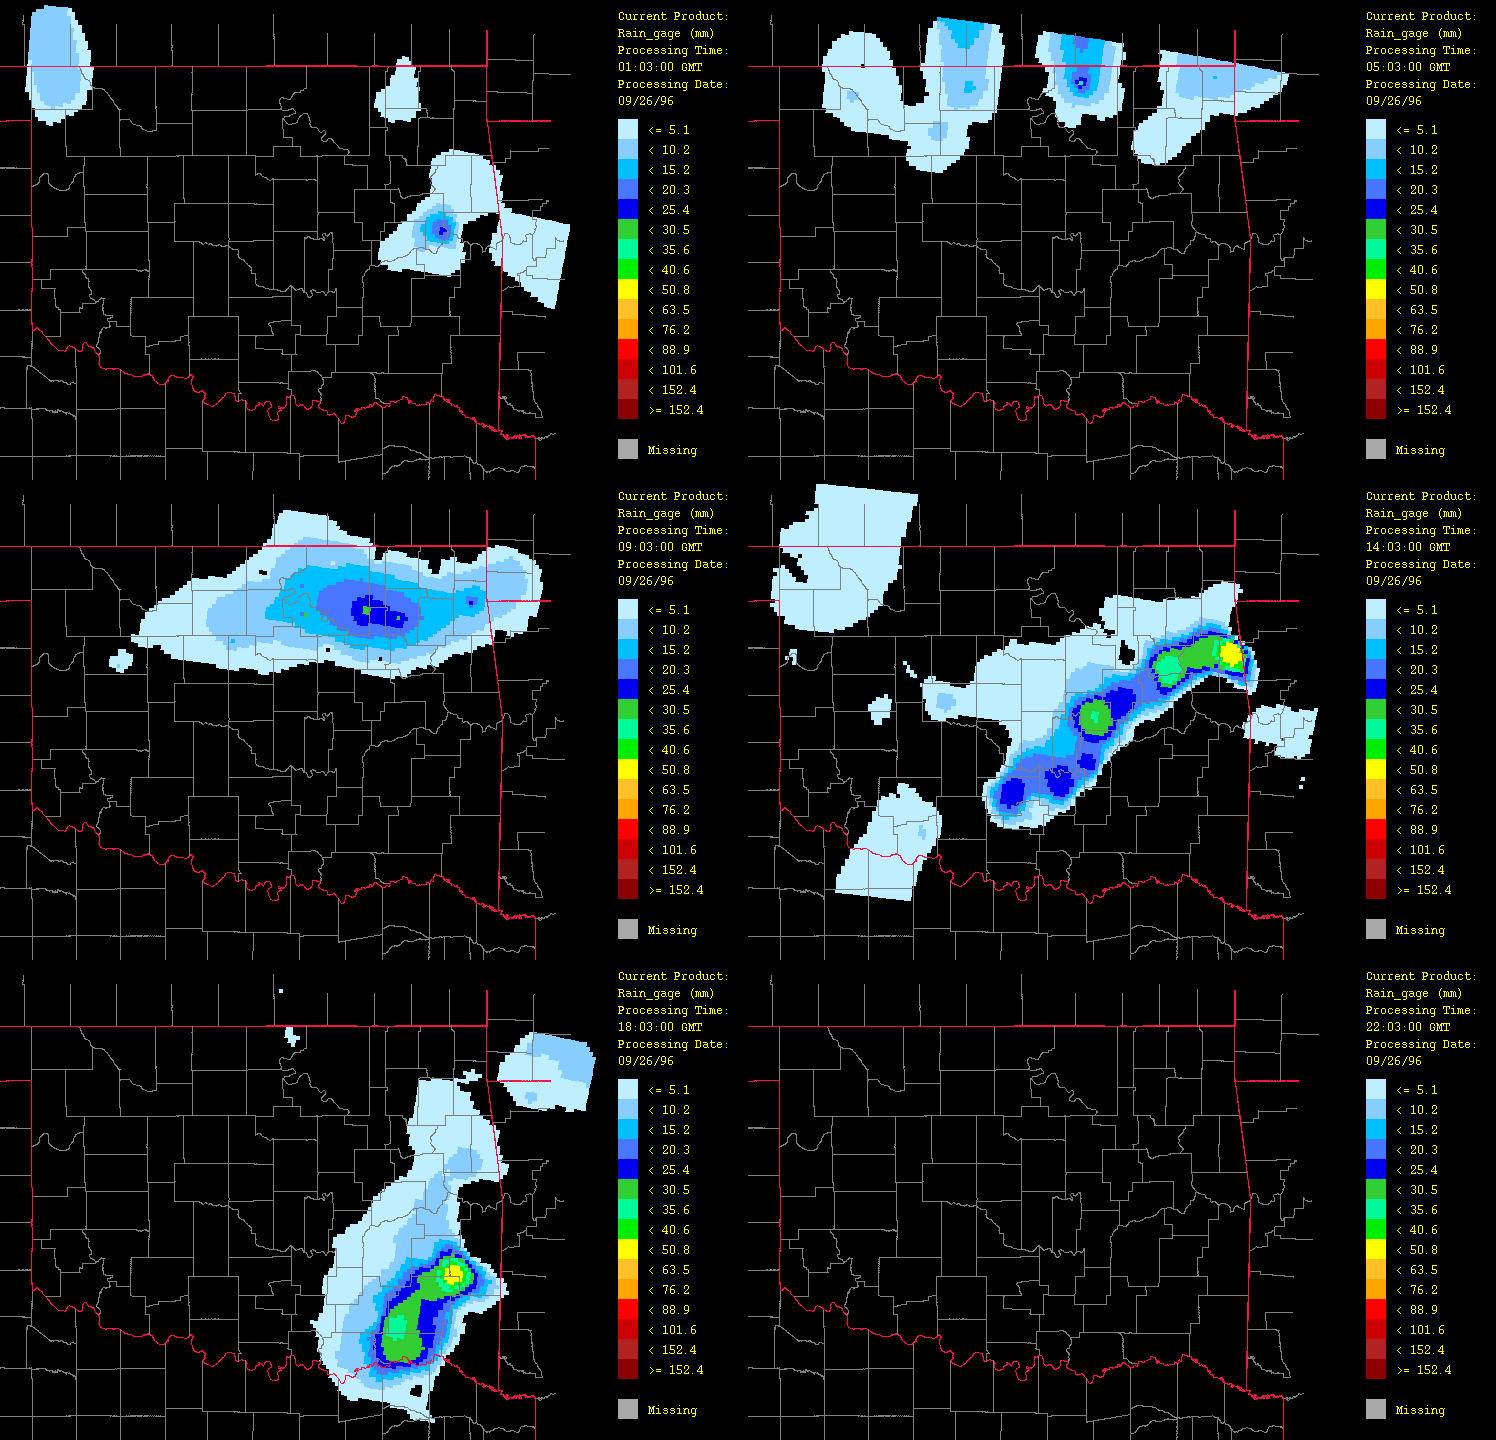
Figure 3: Precipitation for September 26, 1996 from 1:03 GMT to 22:03 GMT over Oklahoma as evaluated using gage-measured data only ("gage-only" product) with the HRWxDS. Units are in mm per hour. Note that the hour 12:03 GMT is missing.
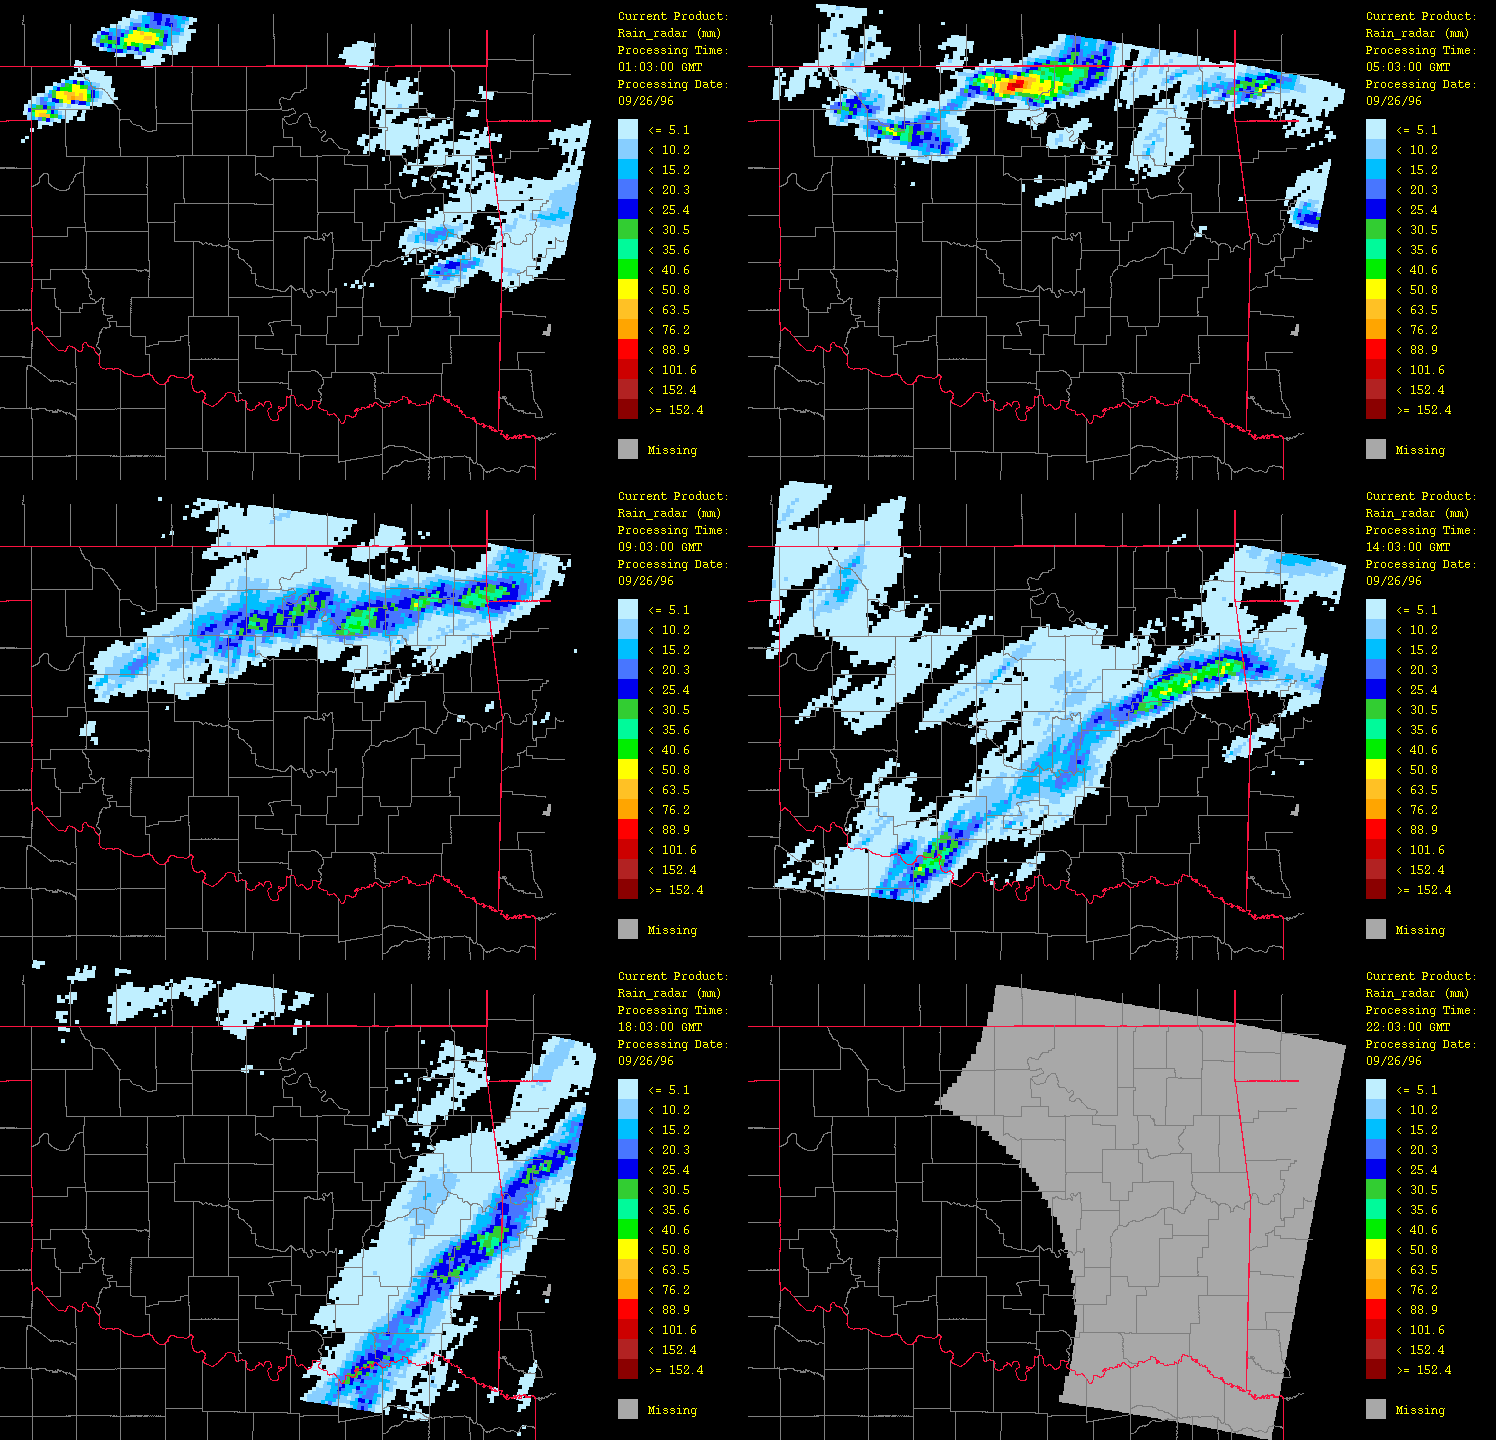
Figure 4: Precipitation for September 26, 1996 from 1:03 GMT to 22:03 GMT over Oklahoma as evaluated using radar estimates only ("radar-only" product) with the HRWxDS. Units are in mm per hour. Note that the hour 12:03 GMT is missing.
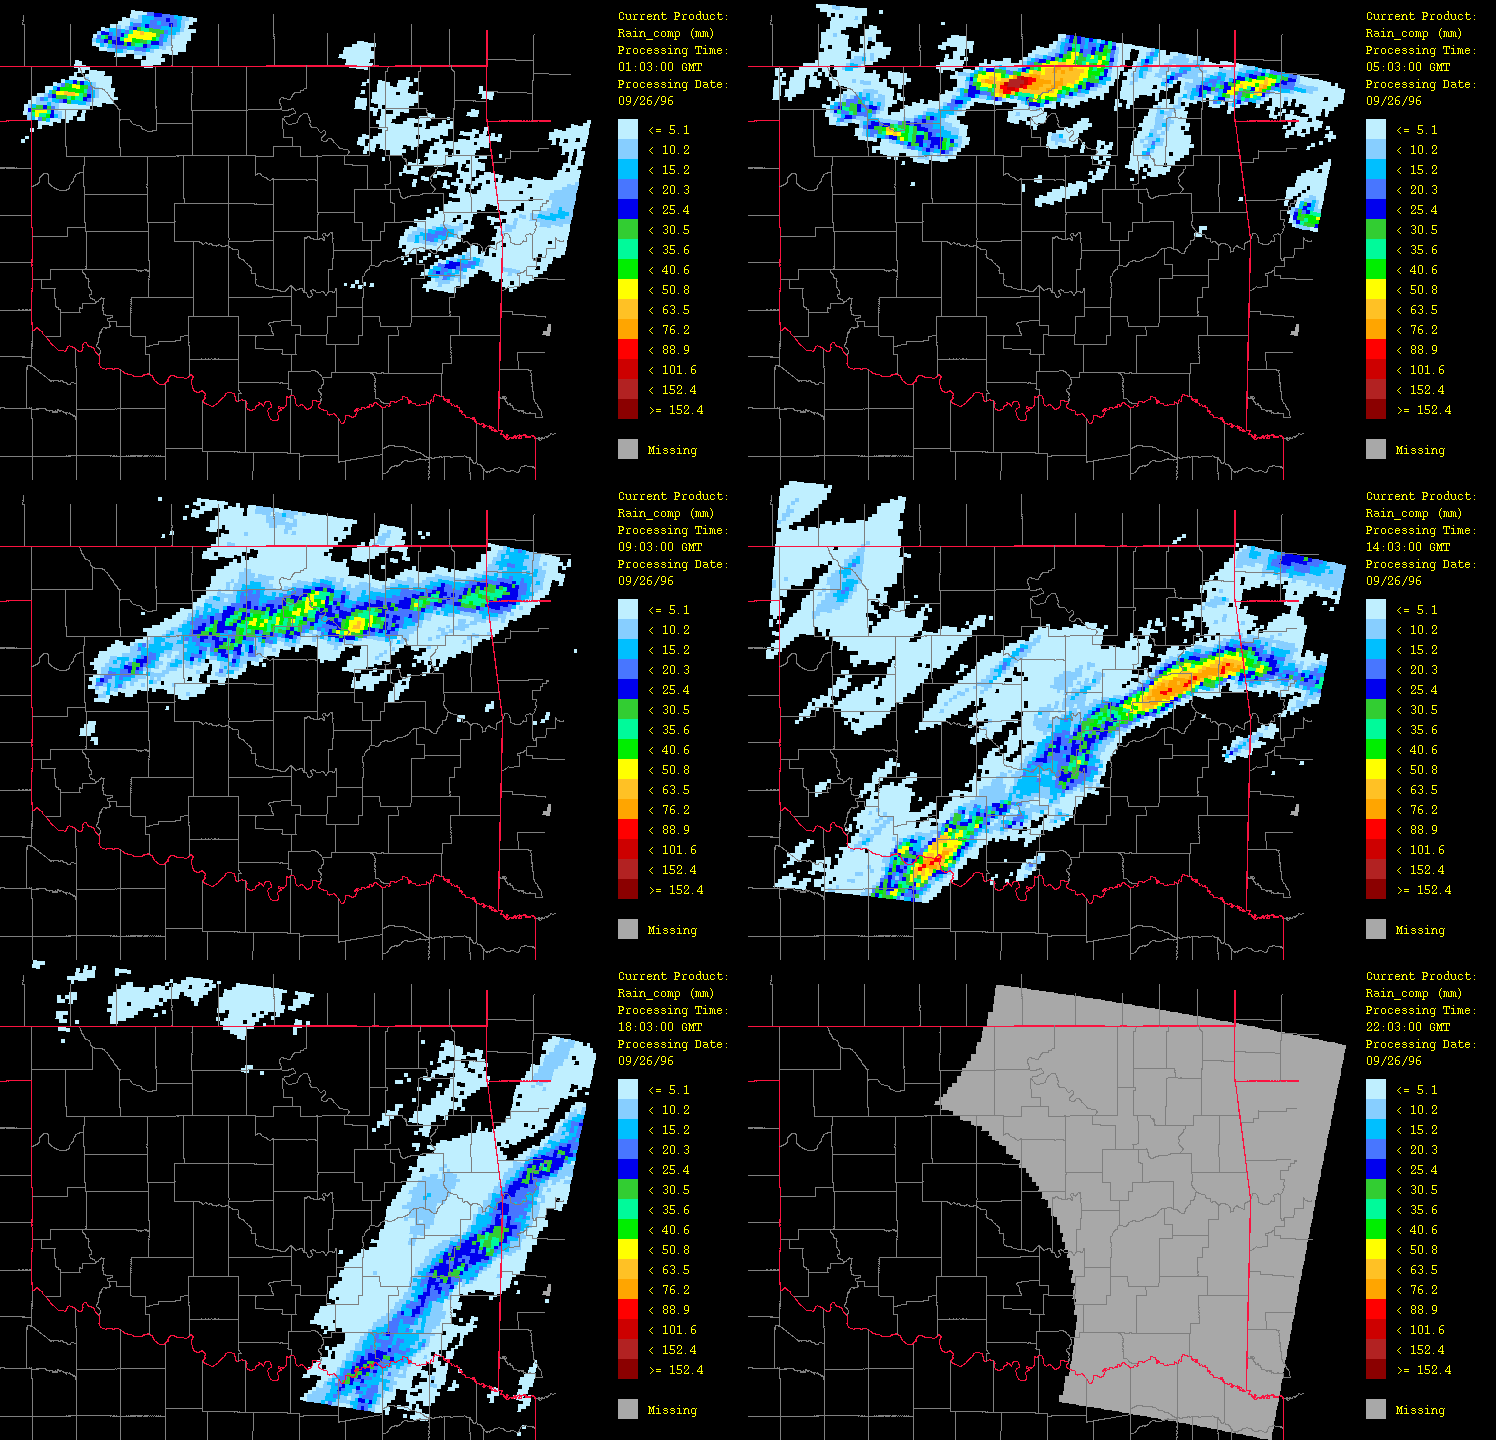
Figure 5: Precipitation for September 26, 1996 from 1:03 GMT to 22:03 GMT over Oklahoma as evaluated using radar estimates calibrated with gage-observations only ("composite gage-radar" product) with the HRWxDS. Units are in mm per hour. Note that the hour 12:03 GMT is missing.
Ancillary meteorological variables presented here include air temperature (Figure 6), dew point temperature (Figure 7), and wind vector (Figure 8). The cold front is clearly evident here, marking the contrast of the warm, moist air flowing up from the southeast from the advancing colder, drier air from the northwest. Animation of the hourly time-series for this event (not shown) illustrates dramatically the rapid advance of this front. Note how including elevation (through use of a digital elevation model or DEM) has enhanced the spatial fidelity in the spatial interpolation procedure.
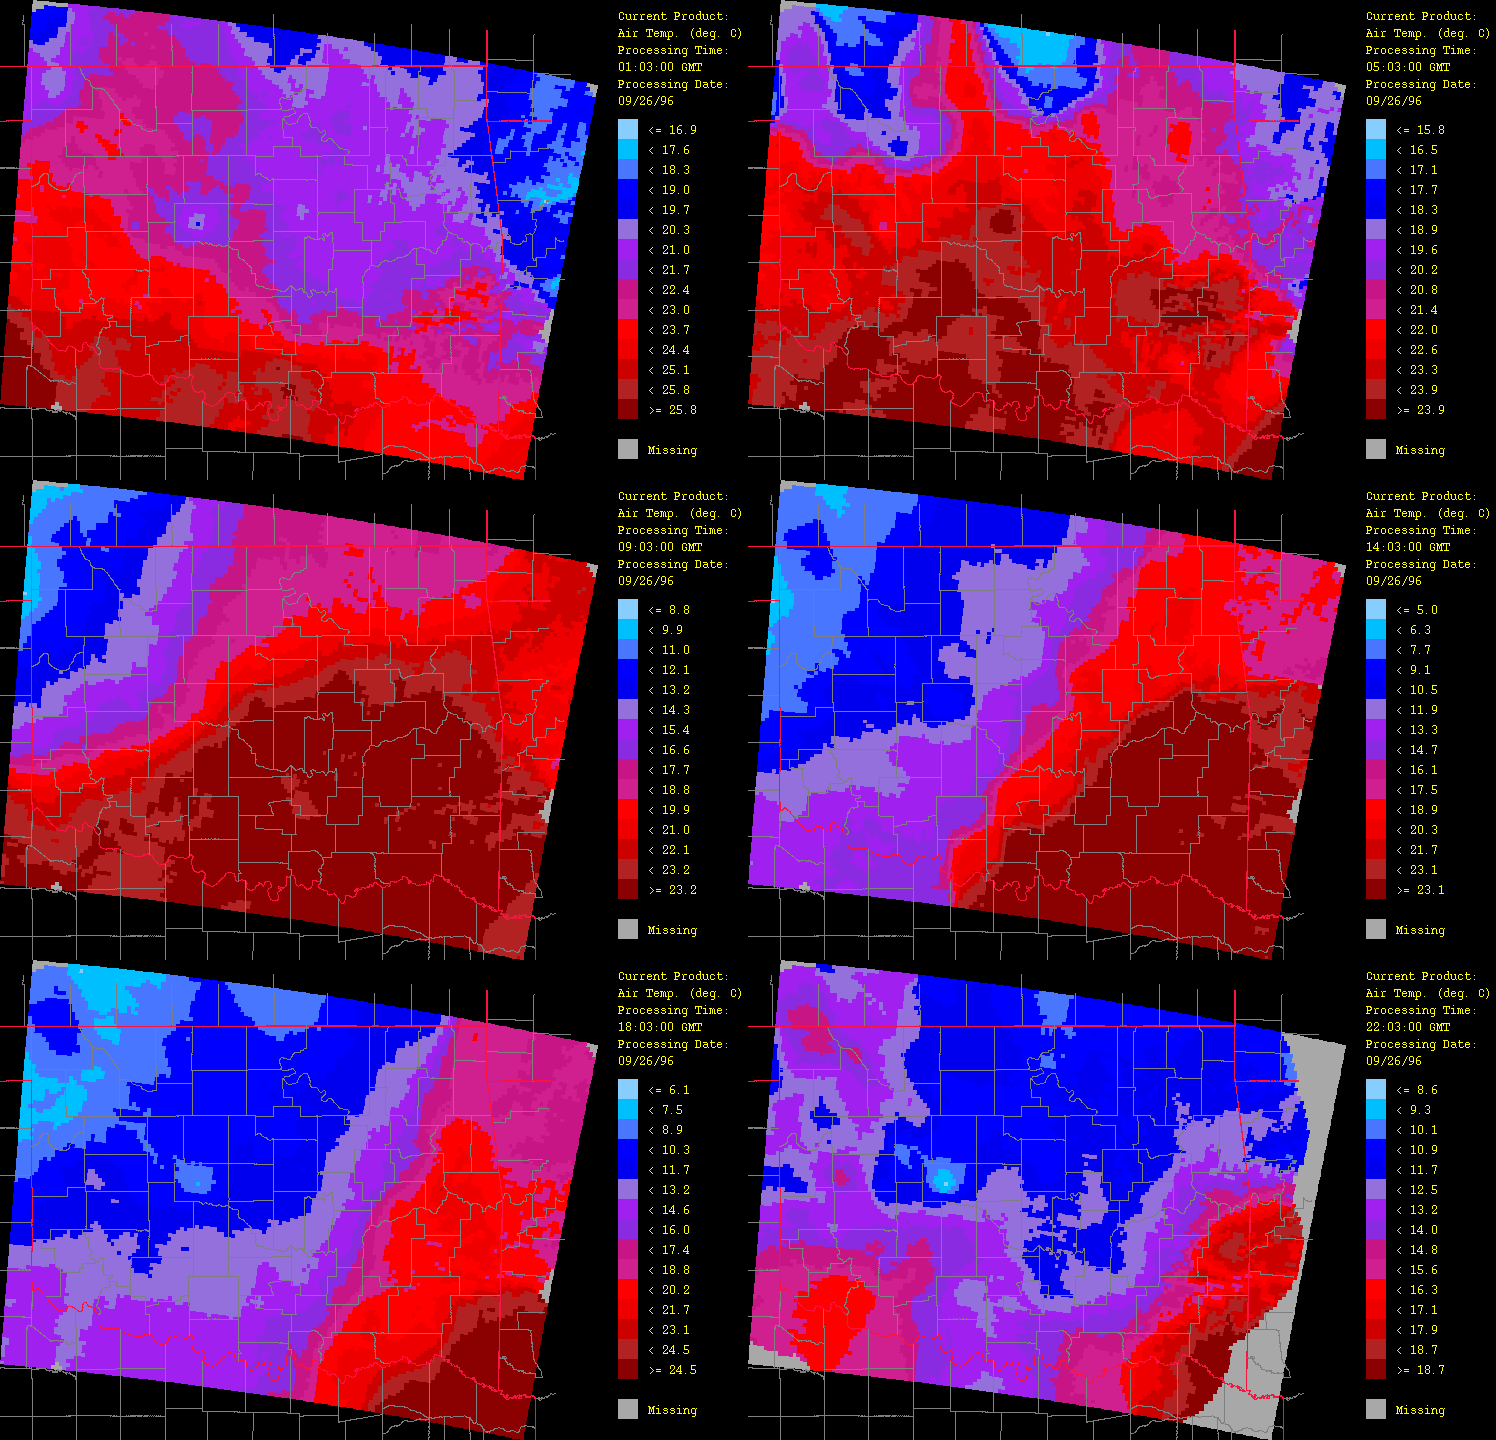
Figure 6: Air temperature for September 26, 1996 from 1:03 GMT to 22:03 GMT over Oklahoma as evaluated by the HRWxDS. Units are in degrees Celsius. Note that the hour 12:03 GMT is missing.
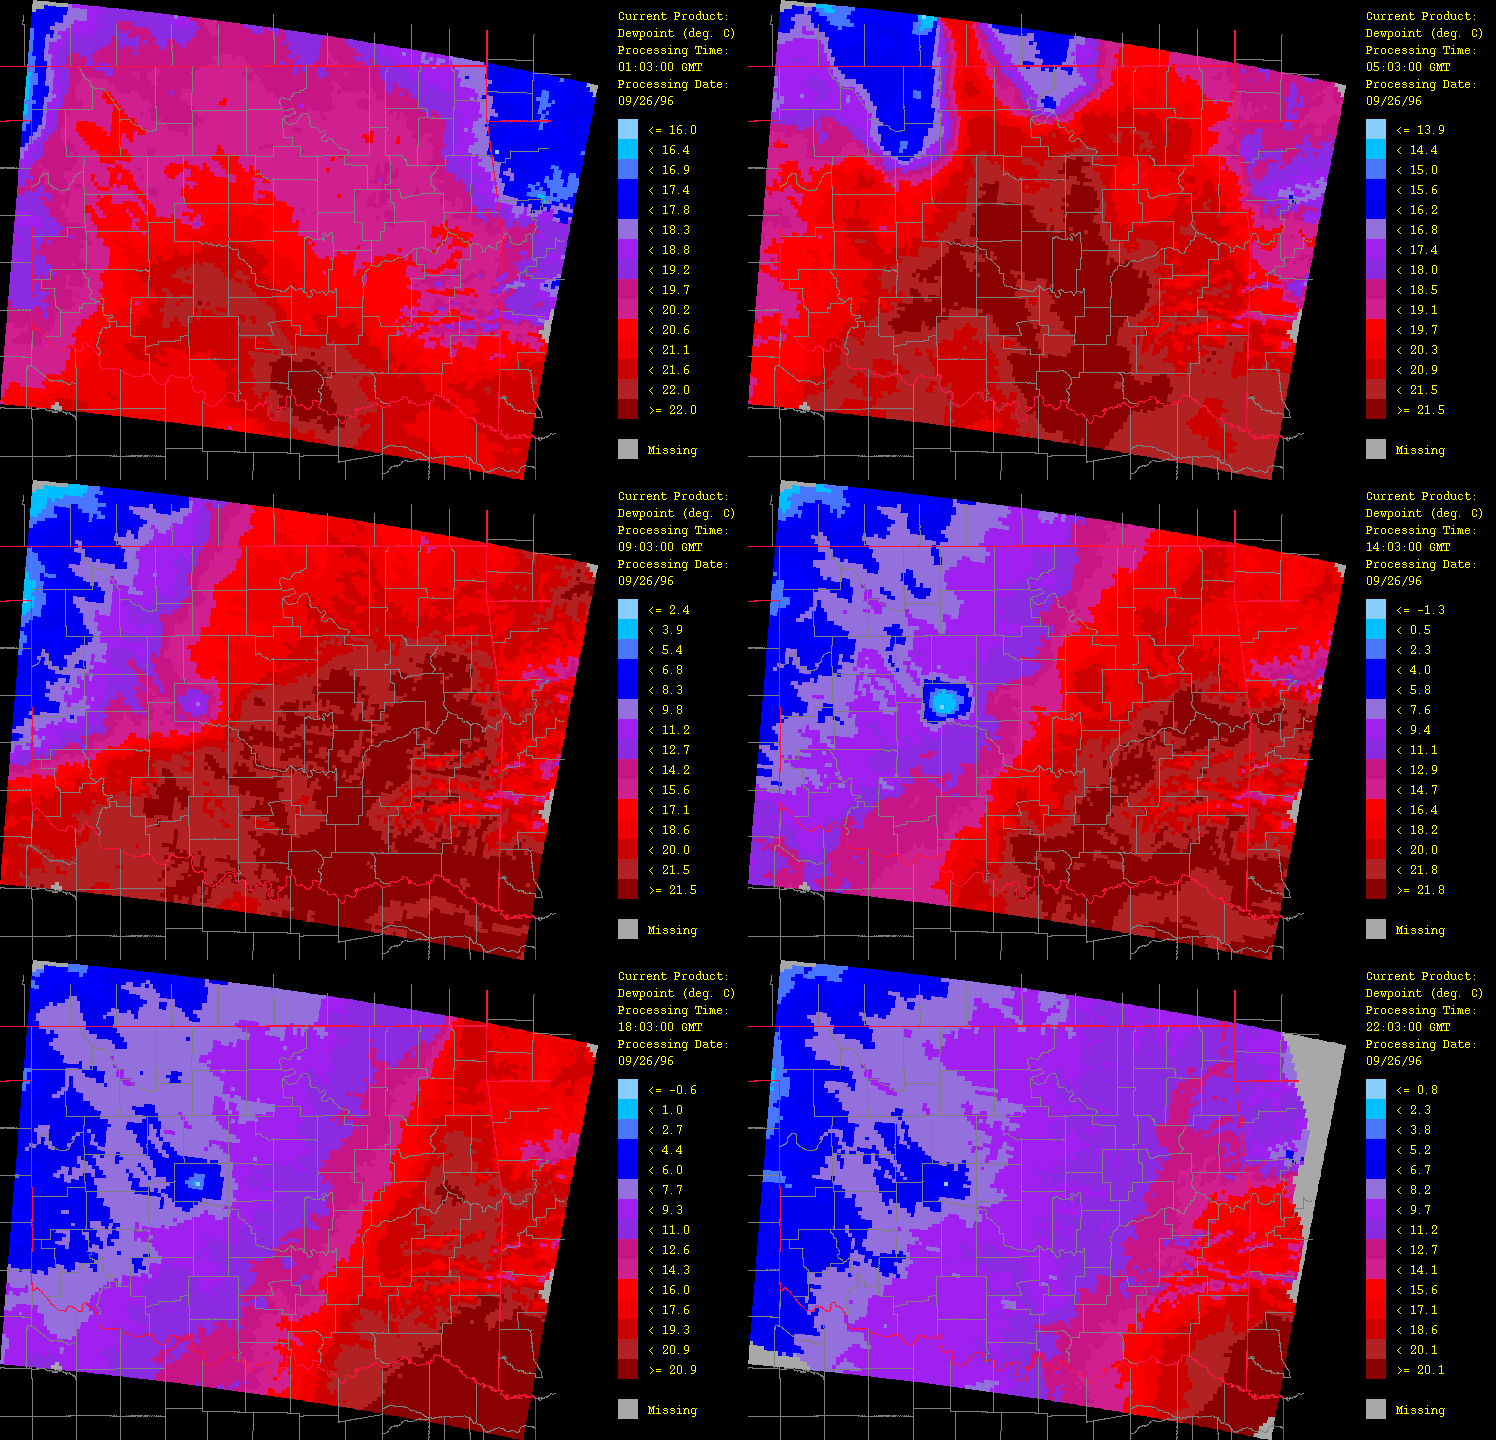
Figure 7: Dew point temperature for September 26, 1996 from 1:03 GMT to 22:03 GMT over Oklahoma as evaluated by the HRWxDS. Units are in degrees Celsius. Note that the hour 12:03 GMT is missing.
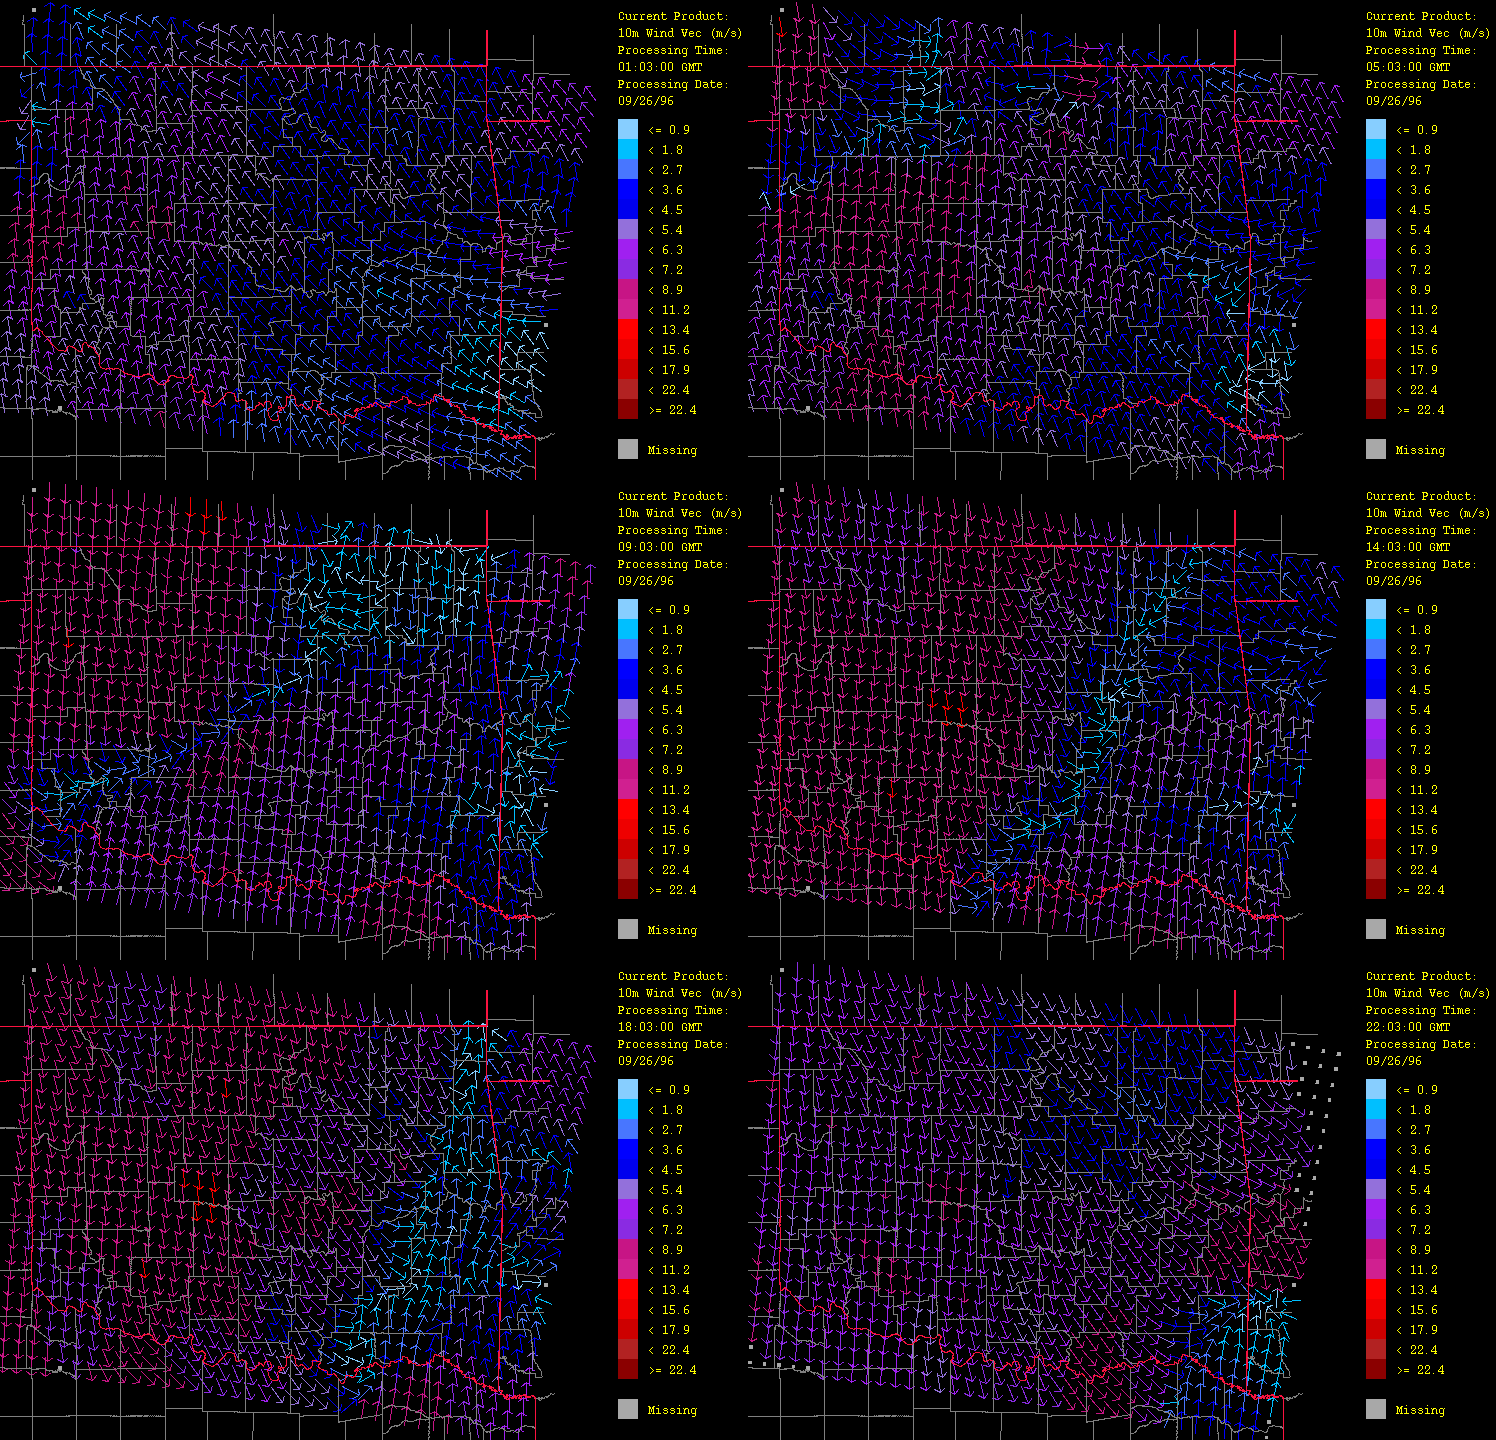
Figure 8: Wind vector (speed and direction) for September 26, 1996 from 1:03 GMT to 22:03 GMT over Oklahoma as evaluated by the HRWxDS. Every fourth arrow in both latitude and longitude only are drawn for clarity. The length of the arrow indicates wind speed in meters per second while the direction of the arrow indicates the direction of flow. Note that the hour 12:03 GMT is missing.
The HRWxDS computes several derived fields including the composite-minus-gage difference (Figure 9), the composite-minus-radar difference (Figure10), and the relative humidity (Figure 11). The composite-minus-gage difference field underscores the inadequacy of the sole use of raingage data while the composite-minus-radar difference field shows that calibration substantially raised the radar estimates as expected. Relative humidity is nearly 100% along the front.
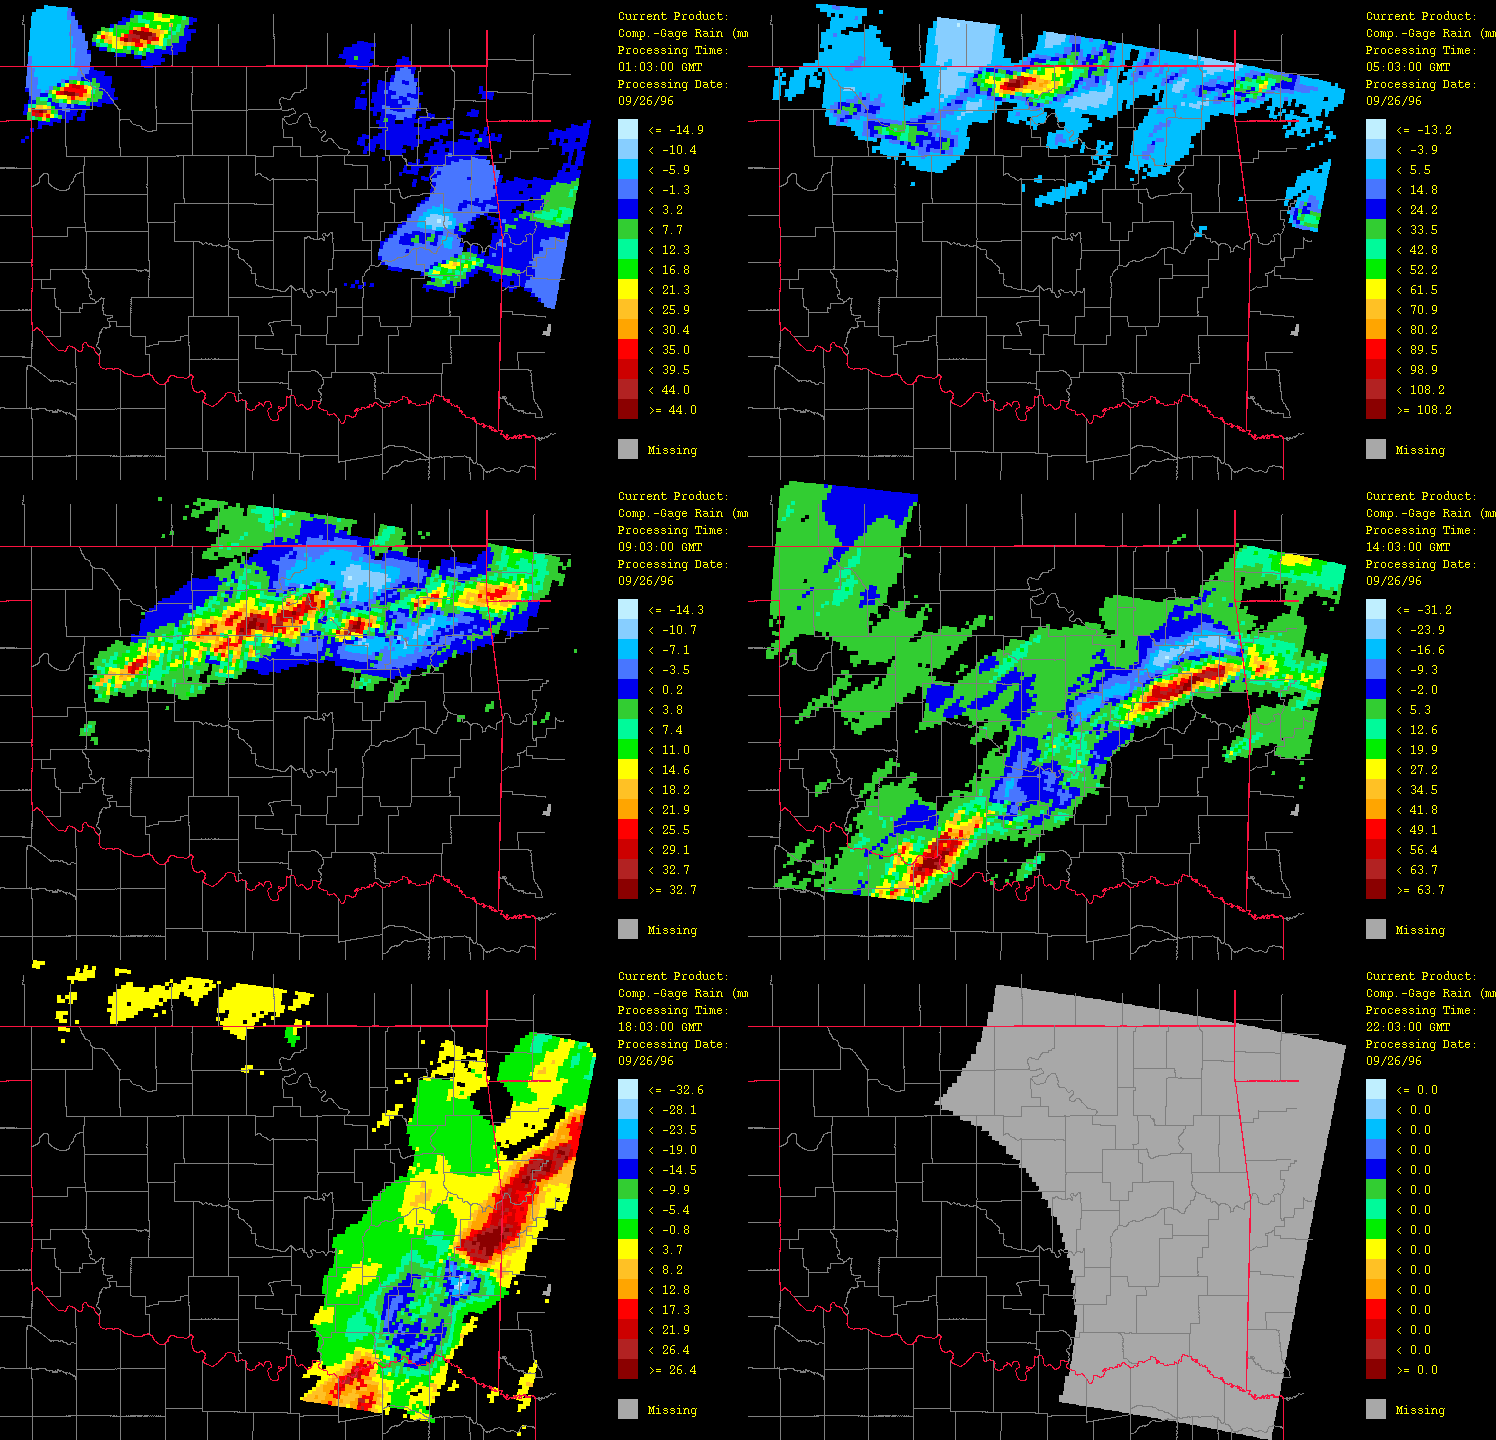
Figure 9: Differences between the calibrated radar estimates (composite gage-radar product) and the gage observations (gage-only product) for September 26, 1996 from 1:03 GMT to 22:03 GMT over Oklahoma as evaluated by the HRWxDS. Units are in mm per hour. Note that the hour 12:03 GMT is missing.
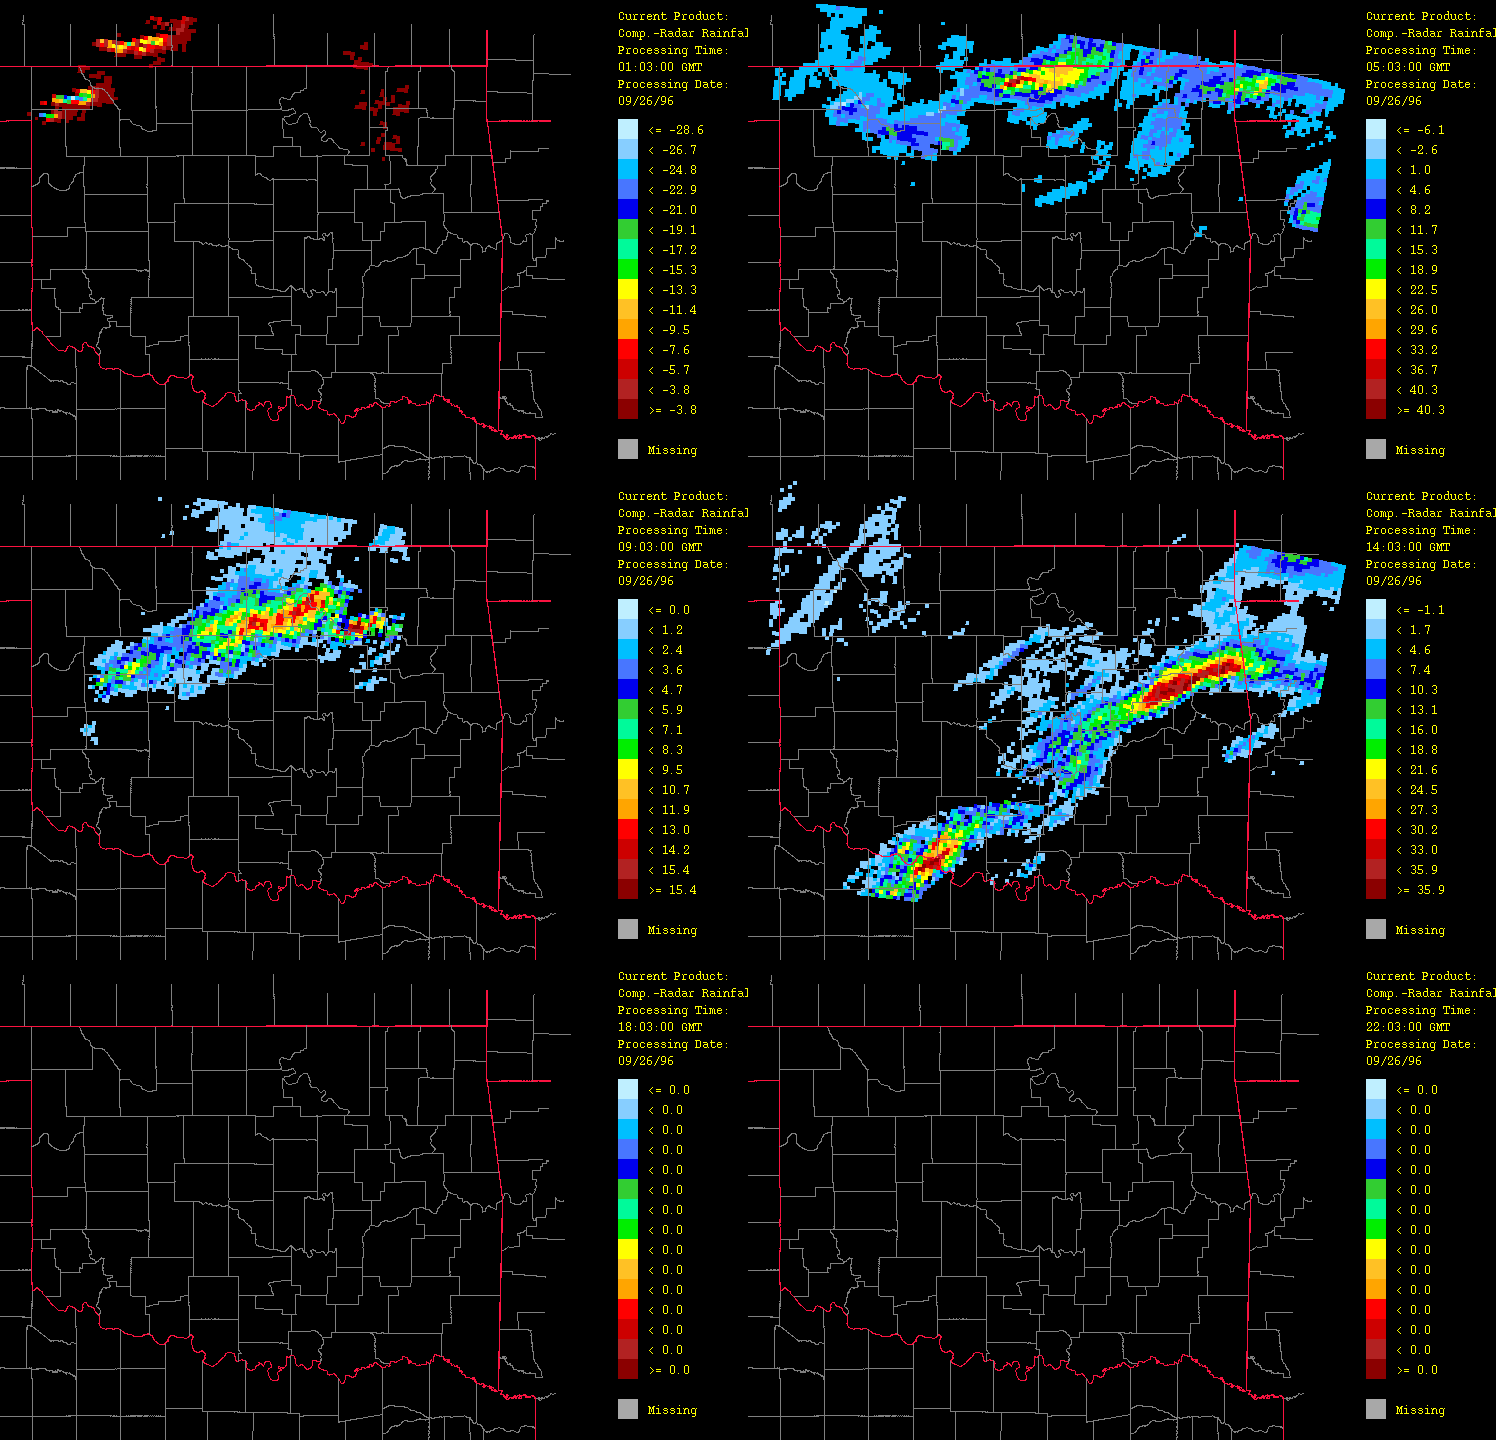
Figure 10: Differences between the calibrated radar estimates (composite gage-radar product) and the uncalibrated radar estimates (radar-only product) for September 26, 1996 from 1:03 GMT to 22:03 GMT over Oklahoma as evaluated by the HRWxDS. Units are in mm per hour. Note that the hour 12:03 GMT is missing.
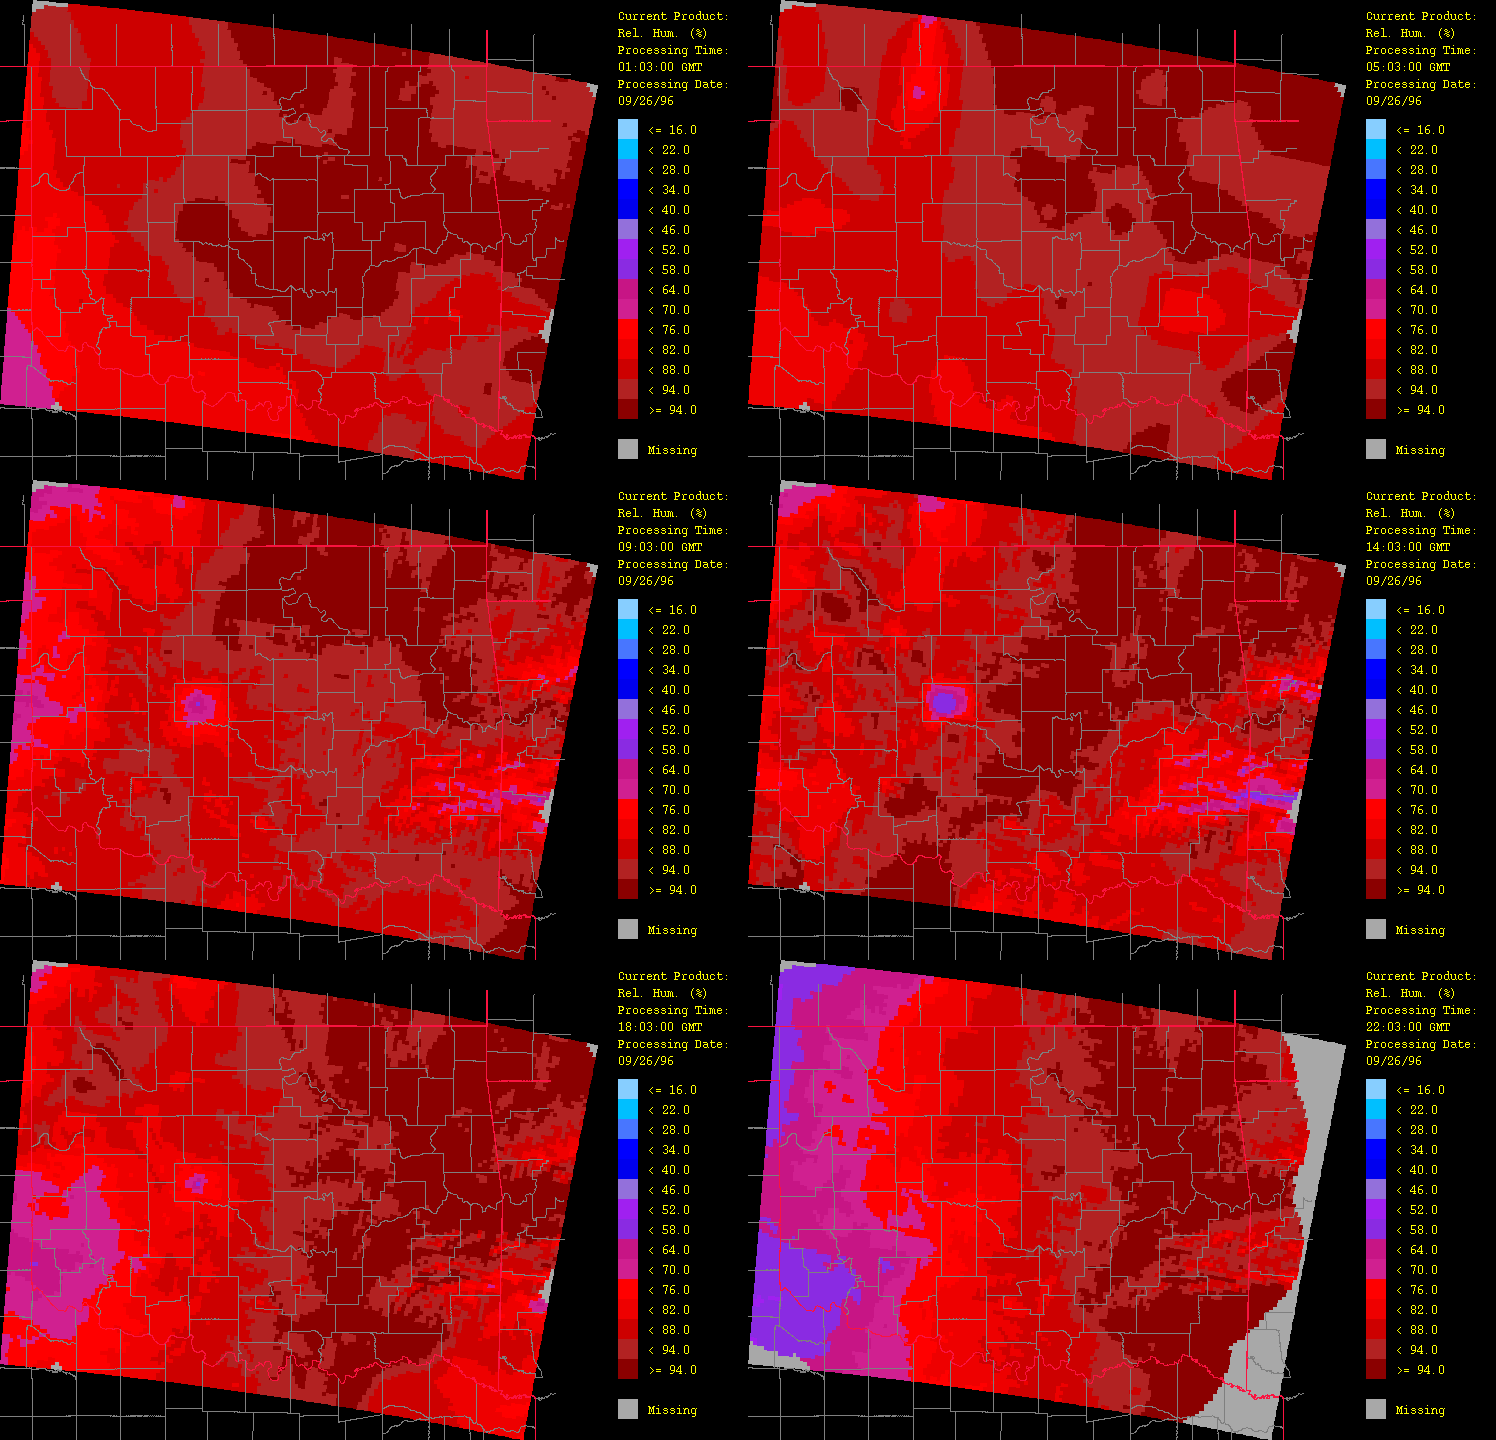
Figure 11: Relative humidity for September 26, 1996 from 1:03 GMT to 22:03 GMT over Oklahoma as evaluated by the HRWxDS. Units are in percentages. Note that the hour 12:03 GMT is missing.
The HRWxDS incorporates an advanced Graphical User Interface for setup, execution, and maintenance of the system, and a sophisticated Product Processing Component to acquire, interpolate, and process meteorological data from both surface and radar observations (Nixon et al., 1999). This system can be used as a stand-alone system for water resource management, or can be used to provide GIS overlays and data input (in NetCDF format) to other environmental models; moreover, it can be used for both real-time monitoring and historical reanalysis. By exploiting the advantages of radar- and gage-based precipitation data, and alleviating their disadvantages (through radar calibration and gage measurement bias adjustment), the radar-gage precipitation product is superior to estimates obtained using only gage- or radar-derived data. To date, it has performed admirably in both real-time and historical assessments (Legates et al., 1996; 1998a,b) indicating it is an extremely useful tool for hydrological and hydrometeorological applications in many areas of environmental science.
Plans are to continue to enhance the functionality of the HRWxDS and develop specific decision support system applications based on the HRWxDS. In particular, a Doppler Radar Irrigation Scheduling System is under development (Nixon et al., 1998) and, in the near future, the HRWxDS will be coupled with "agriculture spray drift models" to provide a decision support system for agriculture aerial applicators (i.e., to optimize delivery to the target field and minimize spray drift).
The authors gratefully acknowledge the contributions of Duke Energy Corporation, who sponsored the initial research and development of the system, and Nick Keener, meteorologist for Duke Energy Corporation, for providing the end-user requirements and interfacing with the software development team. This work also has been supported by the United States Department of Agriculture’s Small Business Innovative Research Program.
Doviak, R. J., and D.S Zrnic, 1992. Doppler Radar and Weather Observations, Second Edition. Academic Press, Inc., New York.
Fulton, R.A., J.P. Breidenbach, D.J. Seo, D.A. Miller, and T. O'Bannon, 1998. The WSR-88D rainfall algorithm. Weather and Forecasting, 13(3):377-395.
Groisman, P.Ya., and D.R. Legates, 1994. Accuracy of historical United States precipitation data. Bulletin of the American Meteorological Society, 75(2):215-227.
Groisman, P.Ya., and D.R. Legates, 1995. Documenting and detecting long-term precipitation trends: Where we are and what should be done. Climatic Change, 31:601-622.
Legates, D.R. 1999. Real-time calibration of radar precipitation estimates. Manuscript submitted to the Professional Geographer.
Legates, D.R., and T.L DeLiberty, 1993a. Measurement biases in the United States raingage network. Symposium on Geographic Information Systems and Water Resources, American Water Resources Association, 547-557.
Legates, D.R., and T.L. DeLiberty, 1993b. Precipitation measurement biases in the United States. Water Resources Bulletin, 29(5), 855-861.
Legates, D.R., K.R. Nixon, T.D. Stockdale, and G.E. Quelch, 1996. Soil water management using a water resource decision support system and calibrated WSR-88D precipitation estimates. Proceedings, AWRA Symposium on GIS and Water Resources, American Water Resources Association, 427-435.
Legates, D.R., K.R. Nixon, T.D. Stockdale, and G.E. Quelch, 1998a. Use of the WSR-88D weather radars in rangeland management. Specialty Conference on Rangeland Management and Water Resources, American Water Resources Association, 55-64.
Legates, D.R., K.R. Nixon, T.D. Stockdale, and G.E. Quelch, 1998b. A water resource decision support system to monitor soil water conditions using calibrated WSR-88D precipitation estimates and meteorological inputs. GIS and Water Resources, R.A. DeWall, ed., Ann Arbor Press, Inc., Chelsea, Michigan, forthcoming.
Legates, D.R., K.R. Nixon, T.D. Stockdale, and G.E. Quelch, 1999. Real-time and historical calibration of WSR-88D precipitation estimates. Proceedings, Eleventh Conference on Applied Climatology, American Meteorological Society, Dallas, TX, 76-77.
Nixon, K.R., and D.R Legates, 1994. Water resource decision support system SBIR phase I report for the US Department of Agriculture.
Nixon, K.R., D.R Legates, G.E. Quelch, and T.D Stockdale, 1998. Doppler radar irrigation scheduling system - SBIR phase I report for the US Department of Agriculture.
Nixon, K.R., D.R Legates, G.E. Quelch, and T.D Stockdale, 1999. A High-Resolution Weather Data System for Environmental Modeling and Monitoring of Meteorological Conditions. Proceedings, Fifteenth International Conference on Interactive Information and Processing Systems (IIPS) for Meteorology, Oceanography, and Hydrology and the Proceedings, Eleventh Conference on Hydrology, American Meteorological Society, Dallas, TX, 521-524.
Shepard, D. 1968. A two-dimensional interpolation function for computer mapping of irregularly-spaced data. Proceedings, Twenty-Third ACM Conference, 517-524.
Willmott, C.J., C.M Rowe, and W.D. Philpot, 1985. Small-scale climate maps: A sensitivity analysis of some common assumptions associated with grid point interpolation and contouring. The American Cartographer, 12:5-12.