
 |
Return to GeoComputation 99 Index
Kingsley E. Haynes, Roger R. Stough and Rajendra G. Kulkarni
The Institute of Public Policy, George Mason University, Fairfax, VA 22030
E-mail: http://policy.gmu.edu
E-mail: rkulkarn@gmu.edu
Transportation networks are characterized by two complementary functions: accessibility to economic activities and mobility to carry out these activities. One of the ways to measure accessibility is the number of opportunities available to a user of a transportation network. For users to carry out economic activities, i.e., exercise mobility, they have to at least have conceptual or perceived links to the activities. Given this, we ask what is the process that leads to the development of these perceived links? We present an analytical approach based on percolation theory to explain the evolution of perceived links to economic activities. A subjective accessibility measure, i.e., a network of perceived links, is developed based on economic opportunities and individual's income levels in a transport region. For this research, a perceived link to an opportunity exists if the user's income is above some threshold. Accessibility to opportunities may be viewed as analogous to the sites and bonds percolation model where sites are opportunities and bonds are conceptual links. In the context of percolation theory, the complex network of sites and bonds is viewed as subject to the critical phenomenon of phase transitions. This paper describes and applies, through numerical analysis, i.e., computer simulation, an application of the sites and bonds percolation model to accessibility. The paper provides an original approach to the investigation of the evolution of perceived links in a transport network and the related mobility of network users.
Accessibility is to transportation what dark matter is to cosmology, the invisible mass that holds keys to many cosmic puzzles. Similar to dark matter, quantifying accessibility could provide guidance to infrastructure planning and development, route and mode choice and guidance; and trip generation and distribution planning and management. Generally people seem to know what accessibility is: the ability to reach opportunities; however, a precise definition is not so simple. This intuitively appealing and important practical idea becomes fuzzier as people provide interpretations of their perception of accessibility to opportunities. This suggests that accessibility is subjective, in other words, what is accessible to some may be inaccessible to others or even irrelevant. Relevancy brings in the issue of individual's preferences or their utility function; however, the utility function is both temporal and spatial, which means that accessibility includes both the temporal and spatial extent of opportunities, i.e., the cost in time to reach opportunities and proximity to such opportunities. The spatial extent depends on topologies of networks. These networks are not static; both the number of nodes and the number of links connecting these nodes change. The only constant appears to be change itself. In short, many interdependent factors play roles in deciding how one may measure accessibility to opportunities. Understanding relationships of each of these factors to one another and to overall accessibility is difficult. The task becomes more tangled when the socio-economic conditions of regions are factored in. So how is one to get a handle on this fascinating but "slippery" (1) concept?
A survey of the literature suggests that accessibility is an idea that seems to wander all over the landscape of transportation networks. It has been modeled as an entropy measure (2), (3), as a topological measure (4), (5) and (6), as a gravity measure (7), (8), as a distance measure (9), (10) and as a cumulative-opportunity measure (11), (12), (13), (14) and (15), and as a temporal/spatial components measure (16). Some hold that "accessibility is a slippery notion" (1); however, Pierie sees accessibility as "maximum contact with minimum activity," an efficiency based concept (17).
In this paper, we develop an analytical approach for measuring accessibility based on percolation theory. Part II explains the motivation behind this model. In part III, an accessibility analytical model is derived. Part IV discusses the results of simulation of the model under different assumptions. Part V offers conclusions and subjects for future research.
Percolation theory has its origins in the study of the flow of fluids in porous media (18). Prior to percolation theory, thinking in many scientific fields was dominated by diffusion theory; percolation offered a fresh new way to think and theorize. There are fundamental differences in the way these two theories describe random processes. In the case of classical diffusion processes, the randomness is ascribed to random movement of agents (fluid particles) in a well-structured medium. With percolation theory, the randomness arises due to the disordered structure of the medium itself while the agents (fluid) are characterized by an ordered structure. In reality, both the medium and fluid are comprised of random components, which makes the modeling of either phenomenon difficult (19). The other important aspect of percolation theory is the ease with which the phenomenon of phase transition can be modeled. Many nonlinear dynamic systems undergo phase changes when subjected to variation in one of the factors that affect interactions between media and agents.
Can we use these ideas to model accessibility to opportunities? Consider, for a moment, a region as a disordered medium consisting of randomly distributed opportunities and the emergence of conceptual (perceived) links to these opportunities as agents spread out through the medium. The phrase emergence of conceptual (perceived) links has the following meaning: an agent has a conceptual or perceived link to an economic opportunity if that agent -if he wishes to- is able to either participate in, contribute to, derive benefit from, such an opportunity. Growth and spread of a network of perceived links to economic opportunities is similar to the growth and spread of bonds between randomly distributed sites a la percolation theory. Note the terms conceptual and perceived are used analogously. With this picture in mind, we could use techniques from discrete percolation theory (20), (21), (22) to describe the spread of agent-induced conceptual accessibility links (influenced in part by income levels) across these randomly distributed opportunities. Certainly such conceptual links will be highly influenced by an agents preference. In a crude way one can argue that income could be used as a proxy for preferences. The greater an agent's income, the greater the conceptual access space. If such a description can be given, then it may be of interest to determine the level of income that would determine the phase change of the region from a sparsely dispersed network of accessibility links to a region that has very dense or completely connected accessibility links to all the opportunities. In the following parts we develop the background for applying discrete percolation theory to model accessibility, and provide accessibility simulations using the model and explain the results of these simulations.
Consider a large number of spatially distributed entities (e.g., firms, plants, and stores) engaged in various economic activities inside a region. For a resident agent in that region, each of these entities represents a potential economic opportunity. Access to these potential economic opportunities depends in part on that agent's income. Since, we do not know the exact relationship between agents' income and the economic opportunities, it is safe to assume that it may be non-linear. If it were otherwise, it would make the problem trivial.
Let us begin with a simple description of an individual's accessibility to opportunities in a region. Accessibility a across an entire region is a measure of the number of conceptual opportunities n that are available to an individual, where n is a subset of all economic activities (N) inside the region. But how does one measure n, a proxy to accessibility a? A simple answer is as a function of number of conceptual links l to these opportunities. But these "conceptual" links l are dependent on an individual's income I, i.e., the proxy for his preferences.
Thus, we have the following relations:
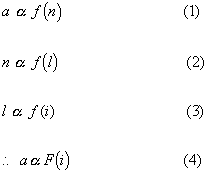
An individual's income captures, to a degree, most if not all of the aspects of accessibility that were mentioned earlier, subjectivity, utility, temporality and spatial extent, as well as socio-economic factors such as demographics, education, ethnicity, etc. But, is the income i dependent on the number of opportunities n? It may be that part of the income is derived from the existence of and transactions among these opportunities. Although, in this paper we assume that during the time of simulation, the number of opportunities remains constant. And the highest income level I does not change significantly. Additionally, other income levels are expressed as a percent of the highest income bracket I and are assumed to remain the same relative to the highest income bracket. It may be that the total number of opportunities in a region is a function of the gross regional product (GRP) and the regional economic growth r.
![]()
This possibility is not addressed in this paper; instead, the total number of opportunities are randomly picked from a fixed interval of a set of economic activities and remains constant for the simulated time period. An individual's income level determines the probability p of a conceptual accessibility link to a pre-existing economic opportunity or the lack of a link (1-p) to the pre-existing opportunity. The type of scenario described above is analogous to the phenomenon of site-bond percolation where the existence or absence of a bond (or site) is determined by probability p and (1-p) respectively (17), (18). In our case, the probability p is determined by and individual's income level i,
![]()
where i is the fraction b times 'I', the highest income bracket, and b takes real values between the interval [0.0 1.0]; thus, a higher income level translates into a higher value of p, hence a higher probability of establishing a link between economic opportunities and vice versa. If the process is repeated for all the economic opportunities in a region, over time, a complex network of conceptual accessibility links to economic opportunities emerges. Such a network evolves from a sparsely connected to a densely connected one, and as it evolves, it passes through a phase transition determined by a critical value of income ic. Note that the form and structure of a conceptual accessibility link network changes as income levels change.
We begin with the following assumptions:
Consider a large periodic lattice with n nodes. A bond between neighboring nodes exists with a probability p; alternatively two neighboring nodes are not connected with a probability 1-p. Let us assume that the nodes represent economic opportunities while bonds between these nodes represent perceived accessibility links; these two together form accessibility sub-networks. Nearest neighbor sub-networks form clusters (Figures 1A and 1B).
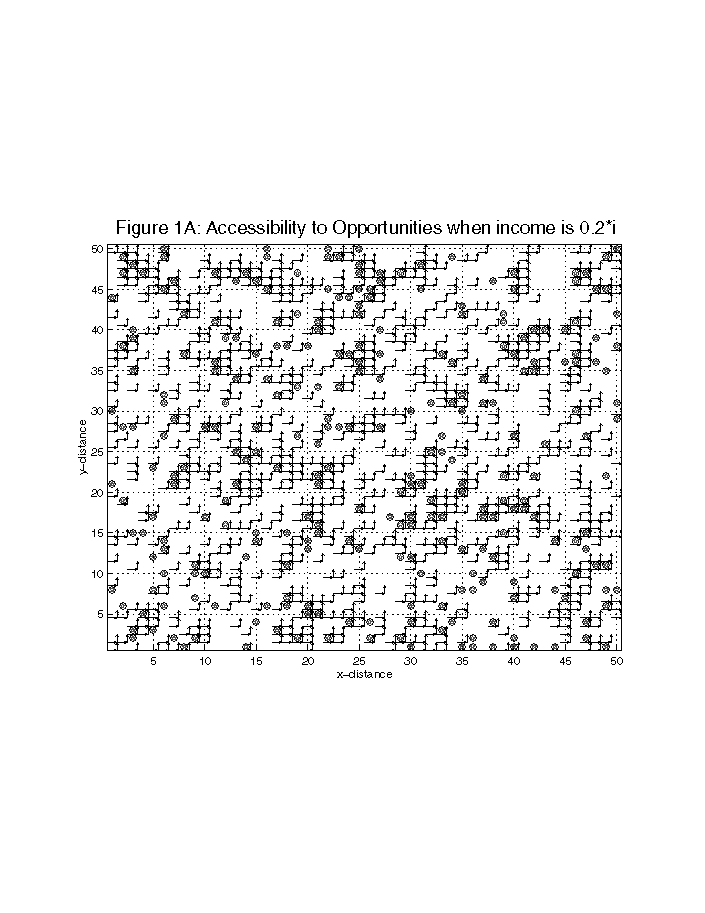
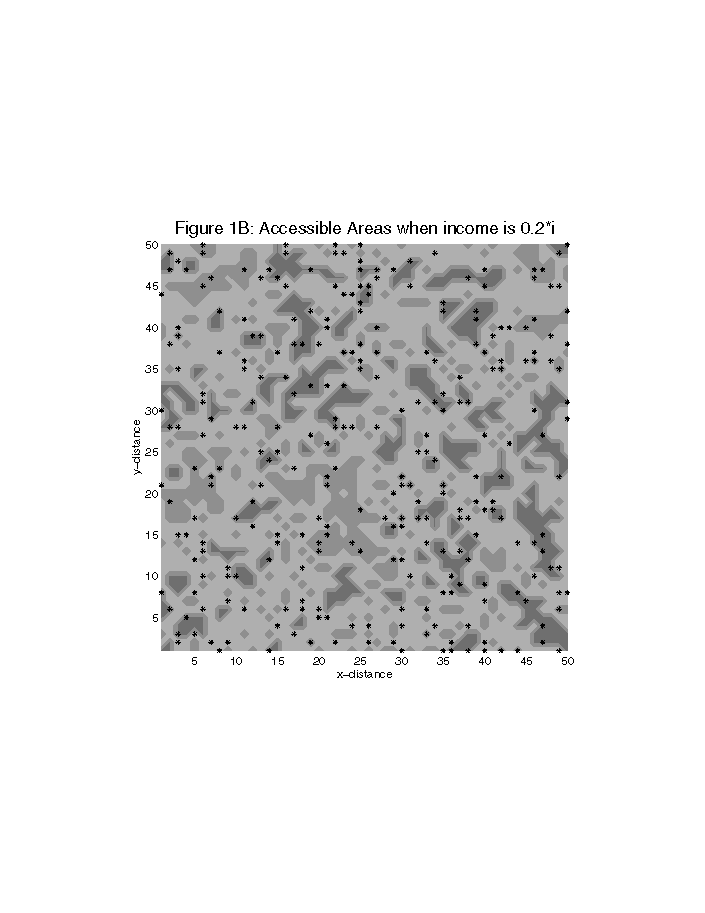
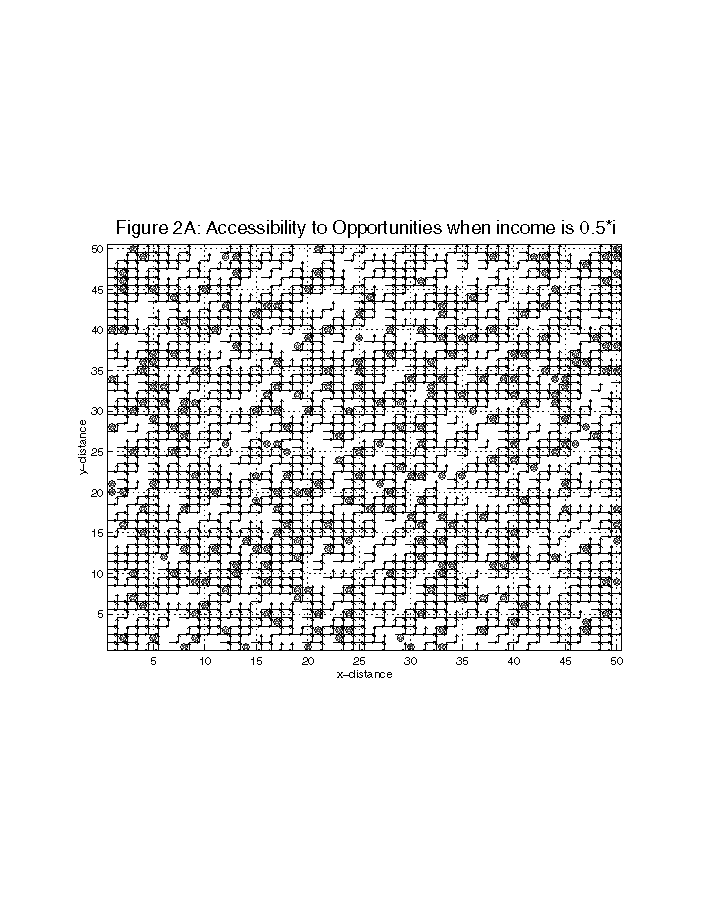
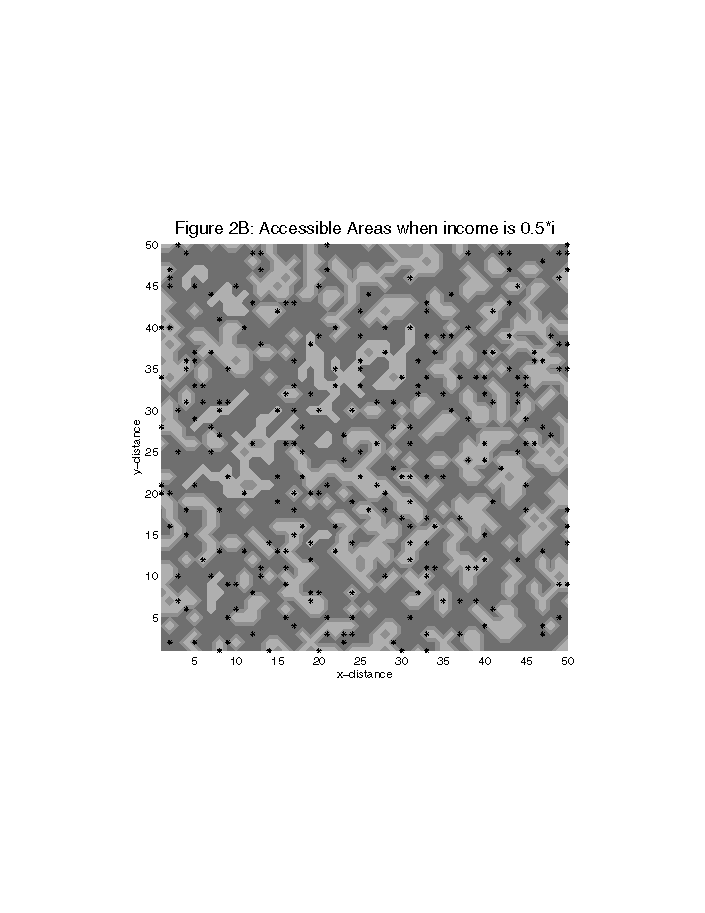
Clusters of all sizes emerge as the value of p increases from zero. At p = pc, the accessibility network system transforms from a structure with sub-networks of all sizes to a single large accessibility network where nearly every opportunity can be reached via a series of other opportunities and conceptual accessibility links. pc is referred to as the percolation threshold and the accessibility network system is said to have formed a backbone (see the connected links in Figure 2A and dark continuous patch in Figure 2B).
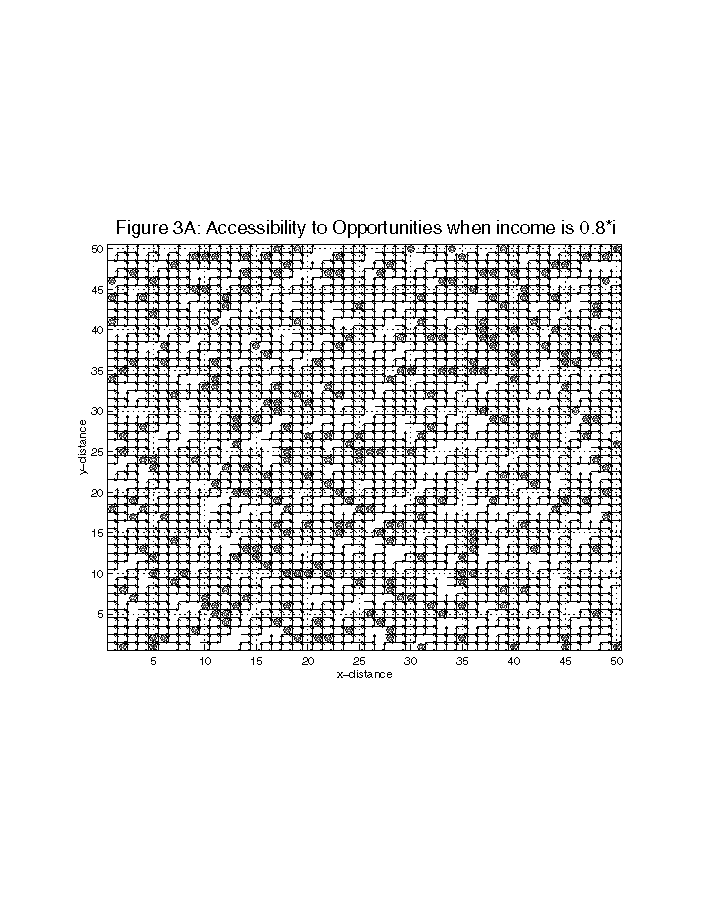
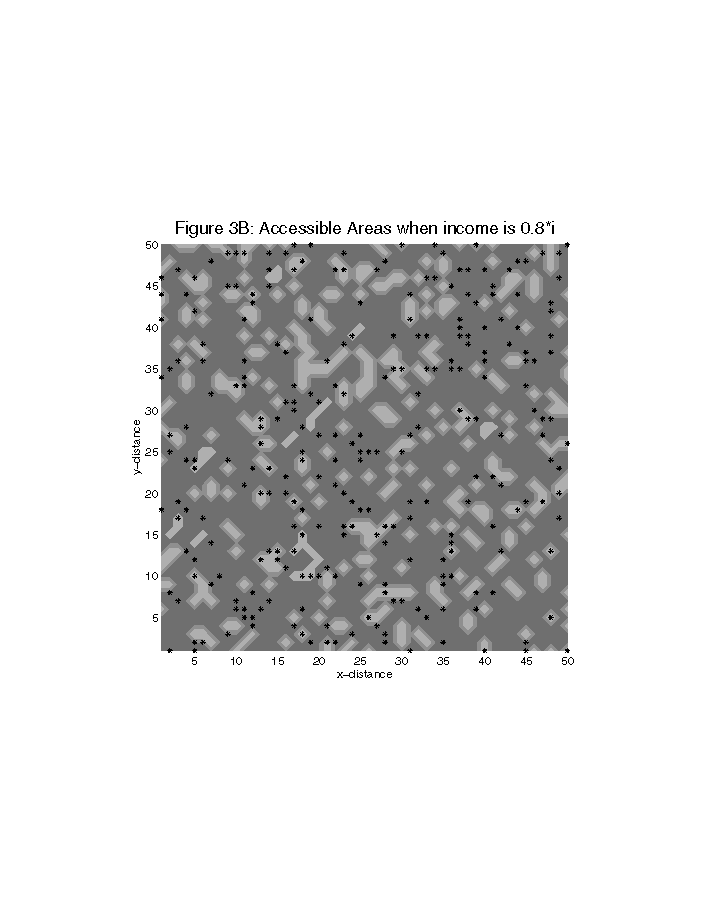
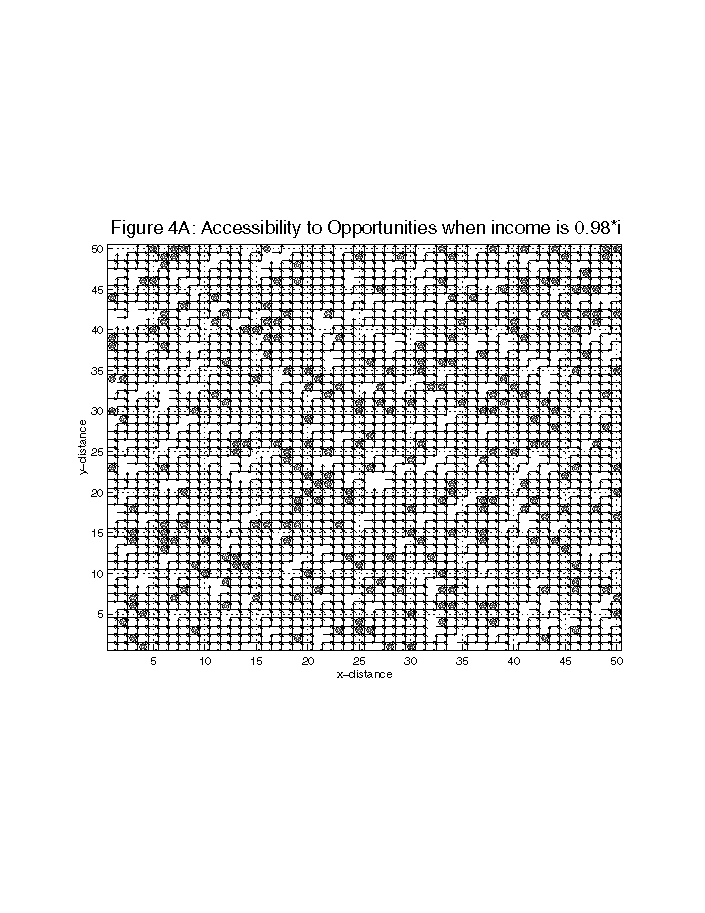
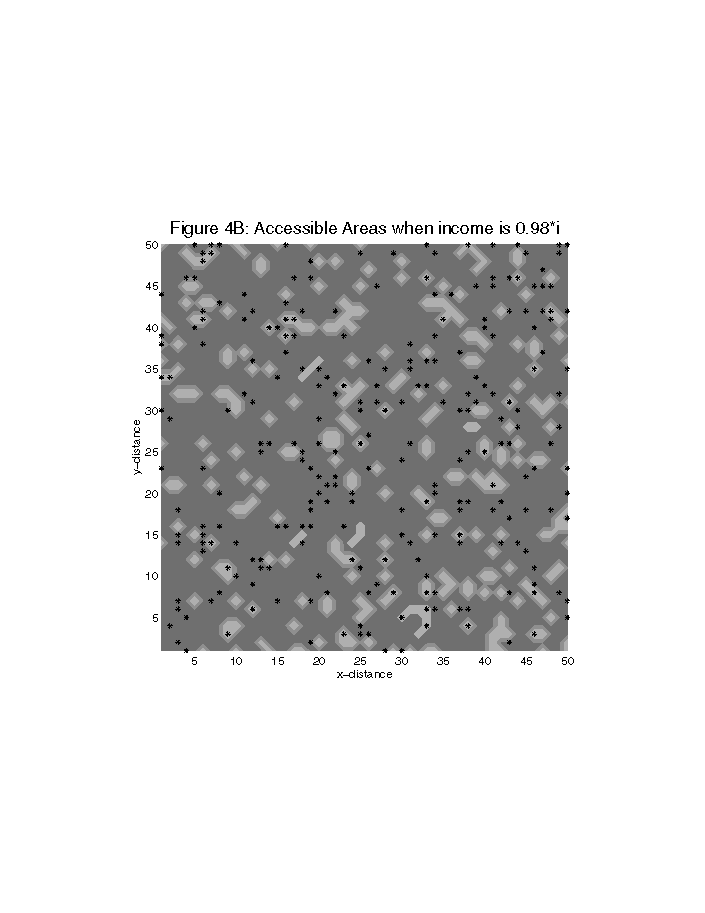
For p > pc, the node-bonds system is said to have undergone a phase transformation, from one consisting of a many clusters of all sizes to a single cluster where there is at least one bond between two neighboring nodes (Figures 3A, 3B, and 4A, 4B).
In other words, the accessibility network system transforms from sparsely connected into fully connected. The phenomenon of phase transition is universal and is characterized by power law relation between different parameters, such as cluster sizes. Power laws are useful because they have universal constants that depend only on the geometry (dimensionality) of the system; thus, a 2-D site-bond system at the percolation threshold is characterized by an order parameter M, a correlation length g , and cluster size S. The order parameter is the probability that a site n or a link l belongs to a very large network and is given by the following equation.
![]()
![]()
The size of accessibility network below and above pc is characterized by a correlation length g . The correlation length is the average distance between two opportunities belonging to the same cluster. At pc, it is determined by the following:
And the average size of an accessibility network is given by:
![]()
where, h , l , n are universal constants that have fixed values for a particular dimensionality.
Consider a 50 by 50 lattice, whose points designate all possible opportunities and arcs connecting each pair of these opportunities are accessibility links. A set of links interconnecting opportunities forms the accessibility link set. Let us imagine that an individual with an income level of i is located at (0,0) end of the square lattice (see Figure 5).
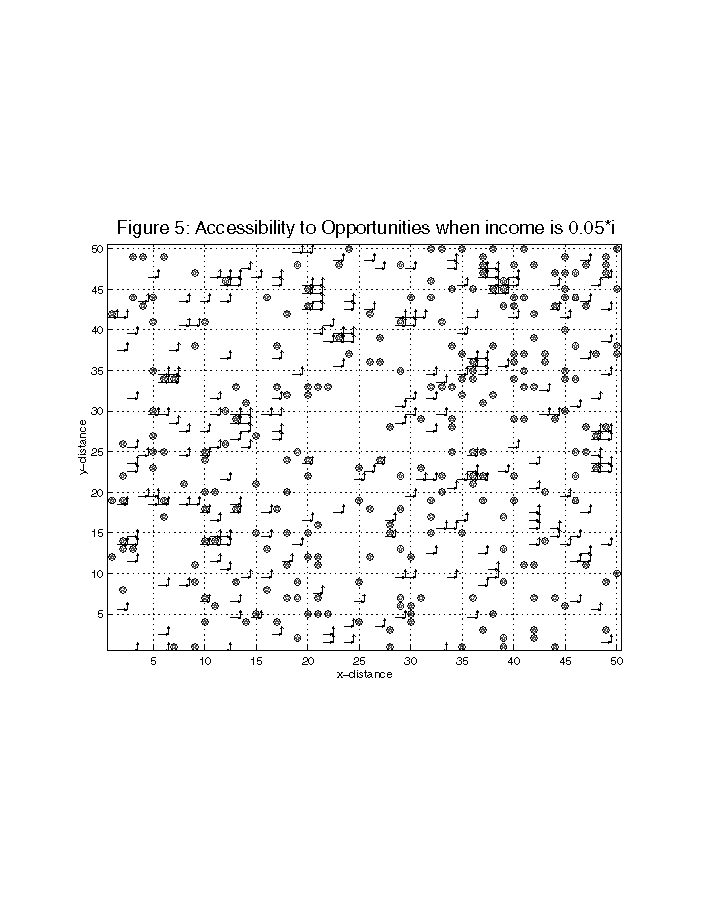
Initially, the lattice is populated with a fixed number of randomly distributed opportunities. At least 10 % of the possible site locations are occupied, for the 50 by 50 lattice; this translates to approximately 250 sites. Initially, there are very few arcs (less than 2 arcs per site) connecting to each site. In short, a matrix T representing the sites, as well as a second matrix A representing the arcs are both sparse. With time there is either an increase or decrease in the number of arcs that is determined by the following rules.
An increase in Gross Regional Product (GRP) increases the number of sites or opportunities, while an individuals income determines how many of these sites are accessible through the arcs connecting these sites. A higher income level translates into greater accessibility, hence, a larger number of arcs. Lower income translates into fewer arcs between the sites. For a fixed number of sites, there exists a critical number of arcs that creates a backbone on the lattice. The backbone ensures that x is connected to a diagonally opposite site via a set of interconnected intermediate sites and arcs. As the number of arcs continues to increase, the backbone spreads and becomes thick such that all sites get multiply connected, thereby increasing overall accessibility to the sites.
In another set of simulation runs, a fixed number of opportunities (~250) were distributed randomly across the entire lattice, i.e., no single region or part had a greater concentration of the opportunities than did any other. The simulations were carried out for different income levels. The cumulative accessibility arcs against time are plotted in Figure 6.
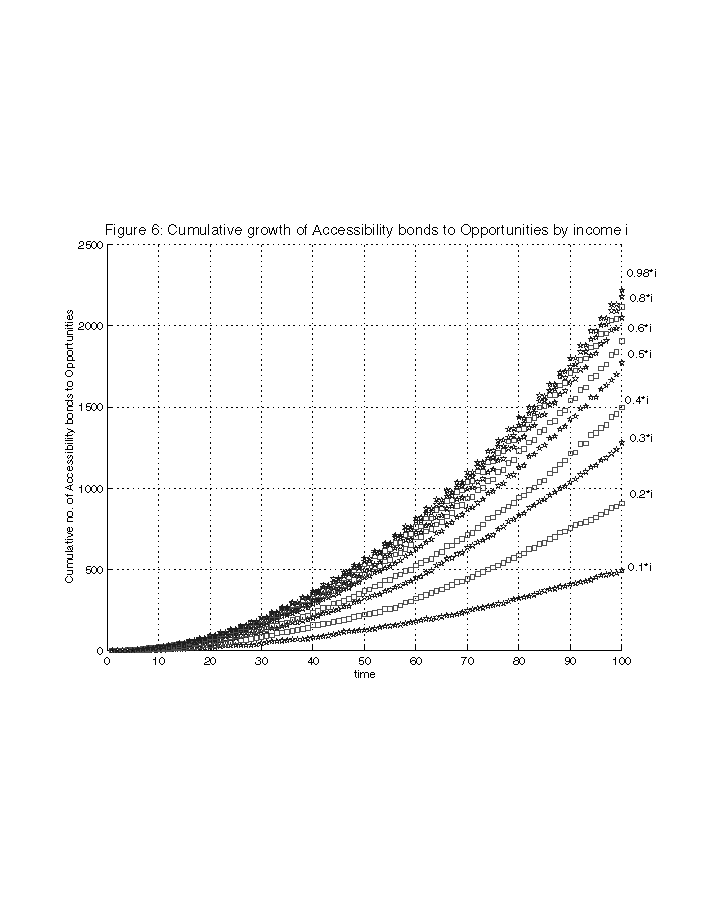
Figure 7 shows the plot of the total number of arcs against the income levels and a curve fitted to the data shows the non-linear nature of the number of arcs to the income levels, thereby suggesting that a nonlinear relationship exists between the number of opportunities and individual's income.
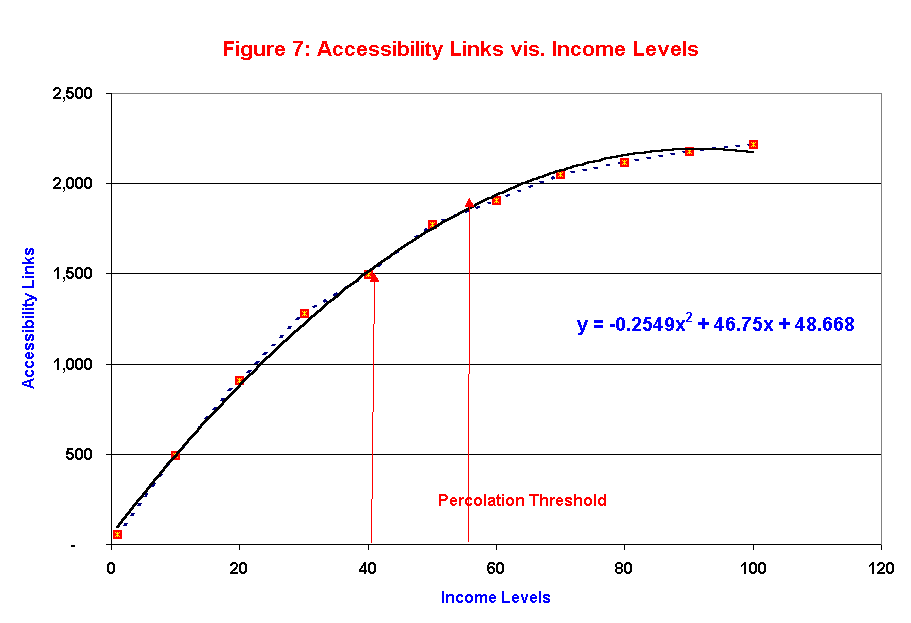
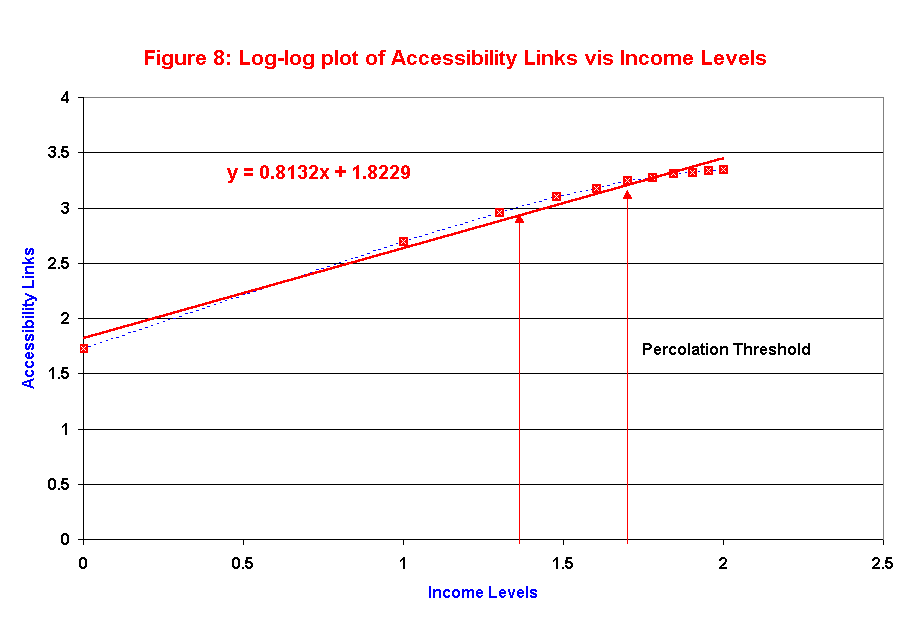
Figure 8 shows the log-log plot of the total number of arcs vis. income levels. The coefficient of the income i (0.8) of the curve fitted to the data is the elasticity of links and the income level, i.e., how a unit increase in income level translates into 1.8*i 0.8 increase in accessibility links.
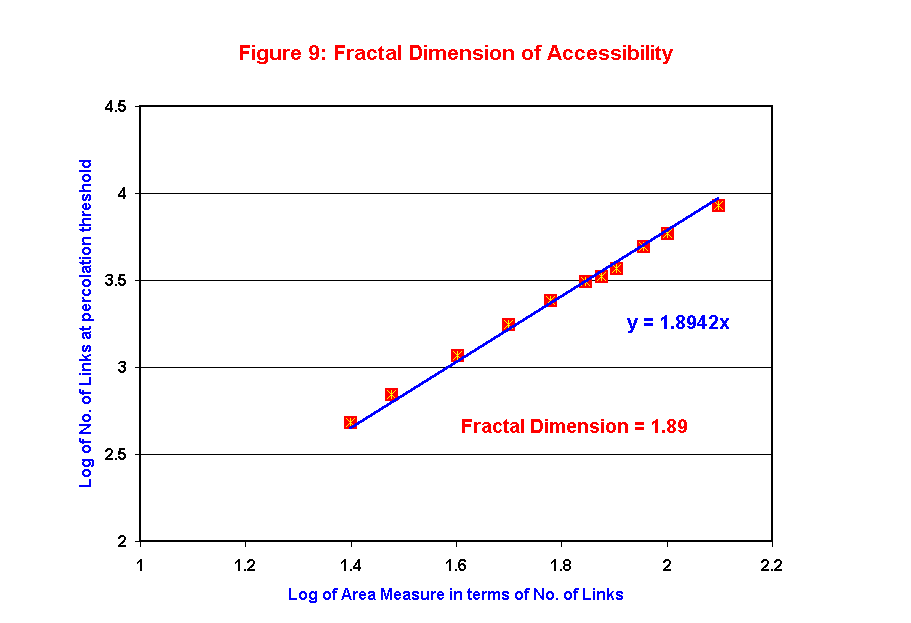
A similar plot for varying sizes of the regions (25 by 25 through 125 by 125) would give us the fractal dimension of the accessibility links space. In general, the fractal dimension d is computed as the slope of a plot of log of conceptual links at percolation thresholds against the sizes of the regions measured in terms of the link length. Figure 9 shows the fractal dimension (1.89) of accessibility computed from percolation thresholds for regions with varying sizes/areas. The computed fractal dimension is higher because of the higher estimates of accessibility links at percolation thresholds. This fractal dimension could be used as an index for computing an individual's accessibility measure. Because mobility is characterized by the ease with which one may reach or go from one opportunity to a neighboring one, it would be possible by assigning costs to each of the conceptual links to extend the accessibility model to a model of mobility percolation.
A simplistic model of accessibility based on percolation theory establishes the phase transformation phenomenon wherein, beyond a critical income level ic, conceptual or perceived accessibility to desired opportunities is guaranteed. Currently, all economic opportunities are considered equal. In the future, a more complex model that would include a combination of variations in both the opportunities and conceptual accessibility links, as well as an interdependent dynamics of opportunities and conceptual links are envisioned. Additionally, using universal constants such as h , l , n , computations of the order parameter, correlation lengths and average size of the accessibility links space can be carried out.
Batty, M., 1993. Cost, Accessibility, and Weighted Entropy, Geographic Analysis. Vol.15, pp. 257-2,680.
Breheny, M.J., 1978. Measurement of spatial opportunity in strategic planning. Regional Studies, Vol. 12, pp. 463-479.
Broadbent, S.R. and J.M. Hammersley, 1957. Proceedings of Cambridge Philosophical Society. Vol. 53, pp. 629.
Bunde, A. and H. Shlomo, 1996. Fractals and Disordered Systems, 2nd Revised and Enlarged Edition. Springer, Berlin, Germany.
Burns L.D., 1979. Transportation, Temporal, and Spatial Components of Accessibility. Lexinton Books, D. C. Heath and Company, Lexington, MA.
Gould, P., 1969. Spatial Diffusion. Commission on College Geography Resource Paper No. 4. Association of American Geographers, Washington, D.C.
Hansen, W. and G. How, 1959. Accessibility shapes land use. Journal of American Institute of Planners. Vol. 25, pp. 73-76.
Haynes, K.E. and A.S. Fotheringham, 1984. The Gravity Model and Spatial Interaction. Sage Publication, Beverly Hills, CA.
Haynes, K.E., D. Poston and P. Schnirring, 1973. Intermetropolitan Migration in High and Low Opportunity Areas: Indirect Tests of the Intervening Opportunity Hypothesis. Economic Geography, Vol. 49, pp. 68-73.
Haynes, K.E. and F. Phillips, 1987. The Cost Constraint in the Maximum Entropy Trip Distribution Model. Geographic Analysis, Vol. 19, pp. 90-93.
Hughes, B. and S. Prager, 1983. Random Processes and Random Systems: An Introduction in The Mathematics and Physics of Disordered Media, Proceeding, Minneapolis, Eds. Hughes B. D. and Ninham B. W. Springer Verlag, Berlin, Germany, pp. 1-108.
Ingram, D., 1971. Concept of Accessibility: Search for an operational form. Regional Studies. Vol. 5, pp. 101-107.
Kirby, H.R., 1976. Accessibility Indices for abstract road networks. Regional Studies. Vol. 10, pp. 479-482.
Mackiewicz, Andrzej and W. Ratajczak, 1996. Toward a new definition of Topological Accessibility. Transp. Res. B. Vol. 30, No. 1, pp. 47-79.
Mitchell C. and S. Town, 1977. Accessibility of various social groups to different activities. Supplementary Report 258, Transp. and Road Research Lab. Crowthorne, Berks.
Pierie, G.H., 1979. Measuring accessibility: a review and proposal. Environment and Planning A, Vol. 11, pp. 299-312.
Sahimi, M., 1994. Applications of Percolation Theory. Taylor & Francis, Bristol, PA.
Sahimi, M., 1995 Flow and Transport in Porous Media and Fractured Rock: From Classical to Modern Approaches. VCH, New York, NY.
Sherman, L. B., Barber, and W. Kondo, 1974. Method for evaluating metropolitan accessibility. Transportation Research Record 499, TRB, National Research Council, Washington D.C., pp. 70-82.
Taafe, E. and Gaulthier, 1973. Geography of Transportation. Prentice Hall, Engelwood Cliffs, NJ.
Vickerman, R.W., 1974. Accessibility, attraction and potential: A review of some concepts and their use in determining mobility. Environment and Planning A, Vol. 6, pp. 675-691.
Wachs, M. and J. Kumagai, 1973. Physical Accessibility as a social indicator. Socio Economic Planning Science. Vol. 7, pp. 437-476.