Return to GeoComputation 99 Index
Gluck, Myke, Ph.D., Lixin Yu, Ph.D., Boryung Ju, Woo-Seob Jeong, and Ching-Tung Chang
244 Shores Building, Florida State University, Tallahassee, FL 32306-2100 U.S.A.
E-mail: mgluck@lis.fsu.edu
Geographic data are often presented in maps and tables using GIS viewers, spreadsheets, and other software. This study developed and tested a data presentation tool that integrated a map viewer, seriation matrix, and sound generator to study how users receive and perceive spatially related information to improve perception and interpretation of the information.
Seriation is the process of looking for univariate sequences in data, such as a chronological sequence at archeological sites of pottery shards. Seriation, also called reorderable or permuted matrices, may be used as a tool for discovering patterns in numerical data. Seriation data matrix cells contain icons proportional in size to data values rather than actual data values. Users of a seriation tool permute rows and columns of the matrix to visually discover graphical patterns of the data with meaningful interpretations.
Augmented seriation uses a computer graphical user interface to add interactive manipulation, color, sound, and map views to the basic seriation techniques. Augmented seriation permits simultaneous display of maps and iconized data matrices. Augmented seriation's maps and matrices are graphically linked to permit highlighting (brushing) of related cells in the matrix and map elements (points, lines, or polygons), expanding the use of seriation for more visual analyses of spatial and temporal phenomena; thus, augmented seriation permits users to perform a visual principal component-like analysis of numerical and spatial data concurrently. Augmented seriation also employs sound supplementing the visual pattern discovery techniques with aural analyses.
We conducted usability tests of our software implementation with naive geographic users and have found favorable results. Results indicate that after receiving an explanation of seriation, augmented seriation, and a basic introduction to the tool's menus, users can effectively and efficiently employ the concepts of seriation and this tool to discern numerical as well as spatial patterns. In our tests, users discerned patterns in hazards and risk data especially well with the visual tools and, to a lesser degree, the auditory tools.
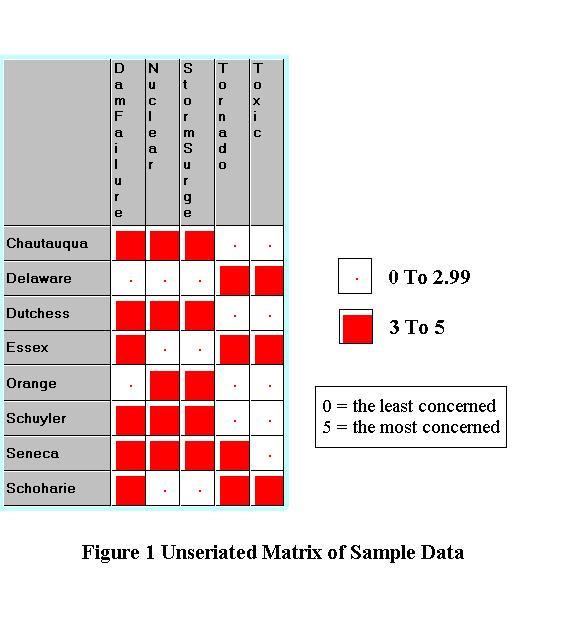
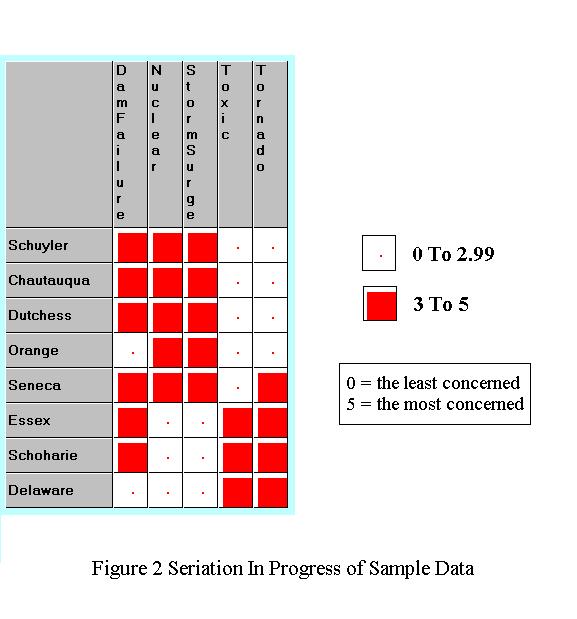
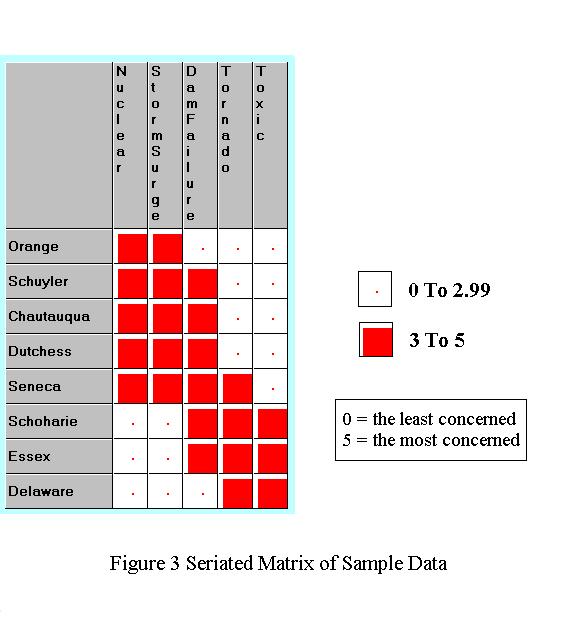
The pre-computer approaches to seriation involved paper and pencil sketches or physically moving objects such as samples of pottery or blackened blocks to permute the rows and columns (Petrie, 1899; Bertin, 1981; Foggin & Aurillon, 1989). Figures 1, 2 and 3 present an example of seriation illustrating the "before, in process, and after" effects of seriation manipulations for a subset of risk perception data discussed later in this paper. Thus, seriation permits users to perform a visual principal component-like analysis of numerical data augmented by spatial and/or temporal analyses (Rodgers & Thompson, 1992) .
Augmented Seriation, a term we have coined (Gluck, 1994; Gluck & McRae, 1997), is a procedure that expands traditional seriation using computerized multimedia. Augmented seriation employs the power of computer graphics, digitized sound, automated spreadsheets, and geographic information systems (GIS) to assist the analyst in discerning patterns in data. Augmented seriation adds features such as color, sound, or a third dimension to the data matrix, provides mapping options, and permits communication between the data matrix and map(s). Sound and color provide the analyst additional perceptual modalities for observing patterns in the iconic data matrix and for assessing the meaning of patterns. As the analyst manipulates the data matrix, maps appearing adjacent to the data matrix provide concurrent spatial and/or temporal pattern identification, recognition, and understanding support. The display of multiple maps can provide spatio-temporal support when each map represents the spatial distribution of data at different times, as does the facility for displaying bivariate choropleth maps. A third dimension also may be added to the data display by incorporating multiple data matrices to provide additional temporal support in seeking patterns in the data when time series data are available much like tabbing in automated spreadsheets.
The earliest recorded use of more sophisticated traditional seriation found in preparation for this work involves the analysis of Egyptian pottery by Petrie (1899). He investigated sequences of successive stages of pottery over time and later used the sequences to date other fragments by material and tool markings. Seriation has been applied to citation data, geological layer data, cartographic analysis, and general information processing problems. Bertin (1981) and subsequently Muller (Muller,1983; Muller & Honsaker, 1984) promoted the technique as a means for data analysis. Bertin and Gimeno (1983) promote seriation as a pedagogical technique for engaging grade school students in higher levels of thinking and analysis. Bertin (1981) also indicates the value of maps in the seriation process, and exhibited data matrices with the cells containing dot maps.
An earlier attempt to automate the traditional seriation process for sophisticated analysis was a computer program for Apple's Macintosh computer environment called MAT written in 1988 by Reijnders and Adams at Eindhoven University of Technology. MAT did not use multimedia (no color, sound, maps, brushing, or third dimension matrices), but is a faithful implementation of Bertin's basic seriation concepts for information processing.
The predominant strategy for seriation exploration has been to diagonalize a dichotomized or bi-valued matrix. This process attempts to form upper and lower triangles with cells lacking certain properties and a diagonal band of cells with high presence of properties (see Figure 3 above). This is equivalent to maximizing the sum of elements in either the upper or lower triangle (assuming 1 and 0 are the dichotomized values underlying the cell icons). This diagonalization strategy does have an assessment criteria as well as a closed mathematical process for binary data. This is not as limiting as it may appear since binary data may result from the presence or absence of a variable at a particular site or from dichotomizing data above or below a critical value of a variable (mean, mode, national norm, etc.).
The diagonalization process with binary data follows a four step process:
Iterations of these four steps continue until the matrix stabilizes which occurs when an iteration leads to no change in the order of either rows or columns.
A test criterion, S, for seriated binary data assesses how well the stable seriated matrix comes to matching the diagonalization objective:
![]()
with j=1 to n, where n is the number of columns of the matrix, Aj is the number of embedded absences (0) in column j, and Rj is the number of ranges of rows of presence (1) for that column.
A perfect seriation will have a value of S=1 representing a fully diagonalized binary matrix with no embedded absences (Figure 3, is the best this data can do); however, any seriation process is problematic depending upon the starting point for manipulations. Often stability in the criteria is achieved but a more optimal solution may exist. This is similar to finding local optimums that are not global optimums. Even with this computational method for diagonally seriating a binary matrix, the interpretation of the best pattern may be problematic. Often, from a practical point of view, a less than ideal mathematical result, reflecting weaker relationships, may lead to useful interpretations while the mathematically best result may not be interpretable.
For constructing seriation criteria for multivalued matrices we have experimented with assigning weighted values between 0 and 1 to cells whose value lies between the maximum and the minimum value for that variable (column). (The interface to the software described below makes re-expressing the data categories very easy, permitting analysts to reclass data to observe both clustering and sensitivity effects.) The weight assigned to the cell is proportional to the size of the value in the cell relative to the range of the variable with 0 being the minimum and 1 as maximum. For example, if the data have ten interval valued categories, the second smallest category cells are given a value of 1/9, the next larger category 2/9, and so forth, with the second largest category given the value 8/9. A four-step process analogous to that described above may then be applied resulting in a criteria for assessing the diagonalization of a multivalued data matrix. Such assigned weights provide some assessment of seriation success but are still often problematic for interpretation. Multivalued matrices also are similarly subject to local optima stability conditions.
Since the success criteria and interpretation of automatically manipulated matrices is problematic seriation is frequently best done using visual and interactive exploration to find meaningful patterns. As a sequential process, seriation can be driven by meaningful hypotheses. An analyst can begin to see a pattern developing, perhaps by random, cognitive or perceptual processes, that generates a meaningful hypothesis for the context. The analyst may then continue manipulations to see how strong a visual image that hypothesis demonstrates, and whether or not it leads to the mathematically best seriation. Our software allows the analyst to manipulate the matrix by moving a row, column, or a block of rows and columns, sorting by column(s) or row(s) ascending or descending, and by invoking the automated seriation algorithm described above.
We have produced the basic matrix, sorting and permutation functions including an undo function using Visual Basic on a Microsoft Windows platform. Visual Basic includes a built-in grid function called MSFlexgrid that is sufficient for our proof of concept work. Cartographic software support is achieved through ESRI's MapObjects LT linked to our other program modules. Brushing, the ability to select information in one window and have it be reflected in another window, is enabled in this software package through message passing between the map and matrix via selection event interrupts when brushing is turned on through a pull-down menu option. The user has basic configuration choices, including:
Multimedia capabilities include visual and sound augmentation to these basic seriation functions. Color saturation ranging (low to high or high to low) for multi-valued data provides redundant color to support the visual search for patterns in the data. Any of the basic hues can be saturation ranged providing gray scale support for visual exploration. We exhibit only one hue for a variable within the matrix at a time since color is not a size variable (Bertin, 1981).
Cartographic display support for spatial data permits the analysis of spatial relationships. Maps may be presented in adjacent windows on the display screen. Currently only single variable or bivariate choropleth maps are available, but dot and graduated circle (raw or psychometrically adjusted) maps as well as multi-variable maps including hue with dots, hue with graduated circles, multiple hue dots, and hypsometric are planned. Brushing is available between the map(s) and matrix windows.
Sound options are included to support the search for patterns. All the sound options currently developed are functions of the underlying data value or the number of data classes. Currently, tone or volume ranges serve to subdivide the data much like the category scheme for icon size for the matrices. Rows and columns or subsets of them may be "played" with a choice of several sound responses. Various pitches, timbre, number of tones, tone duration, and tone frequency options permit the user to richly explore the data aurally as well as visually.
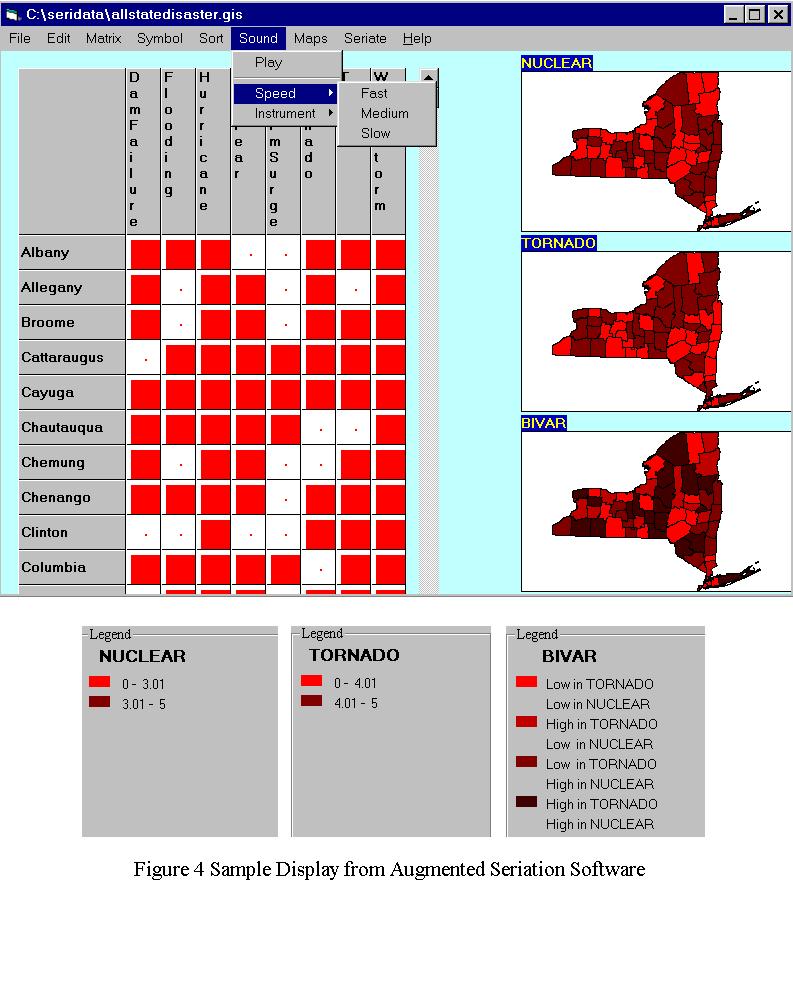
The work also supports viewing temporal changes in data since the software can display multiple maps simultaneously. Display changes in attribute values at locations are illustrated by creating either multiple univariate maps or "bivariate" maps using the same variable displayed at different times. A future options will include enhancements and usability testing of "three dimensional" matrices much like several spreadsheet software products that include tabbed sheets. Such multi-dimensional views generate simultaneous visualization of more than one iconic matrix permitting display of the temporal data changes in the matrices to accompany the spatio-temporal changes in the maps. (See Figure 4 for current interface, map, matrix, and menu displays.)
The traditional usability approach holds a limited yet effective view of humans as information processors because of its roots in engineering and psychology. The traditional usability approach monitors the performance of a small sample of workers on a task, typically capturing their time on tasks and their rate of errors in executing the tasks. Much work in applying the usability approach centers around the careful selection of subjects, composition of subject tested tasks, and assessing user performance by time on task and error rates. The traditional usability approach based in these roots is driven by the dual yet sometimes competing desires to be (1) the servant of users of systems as opposed to being subservient to the technical aspects, and (2) cost effective in a commercial setting. Occasionally usability laboratories will post signs stating "The User Is Always Right" or "The User, Stupid, The User." Based on these efforts and the general attitude of usability professionals, usability analysts have reasonable claims to being the user advocates for the world of information system development and deployment.
General agreement among usability analysts suggests (Rubin, 1994):
1) Effective usability demands an early focus on users and tasks as products and systems are being developed
2) Insistence upon empirical observation and as much measurement of product usage and performance as possible; however, most usability analysts also make qualitative assessments (i.e., satisfaction surveys, focus groups, short term ethnomethodological task analysis) along with these quantitative assessments, and
3) Effective usability evaluation requires multiple assessments of usability during the design and deployment of a product. This usually involves development of a design, some testing with users, modification of the design, more testing with users, and so forth, through the implementation process with testing cycles "beginning" all over again with users as new versions are developed and deployed.
Thus, the overall goal of the usability approach is to identify and suggest preferable alternatives to the weaknesses of an information system, product, or interface as noted by the users of such a system. Issues noted by users are to include both quantitative and qualitative assessments of both usableness and usefulness of a service or product. The usability approach seeks to support the development and deployment processes by assessing the ease of learning, ease of use, degree of user satisfaction, and the value to the user community of highly functional components.
During the summer of 1998, usability testing of the then current version of the augmented seriation software was conducted. Ten participants, each with at least 2 years of computer experience but without geographic or risk assessment expertise, were recruited to test the software. All participants were current or former graduate students with diverse majors from analytical chemistry to adult education. They ranged in age from 25 to 54 with six female and four male participants. Such a user group provides a baseline of usability for the augmented seriation software; those with more computer expertise or statistical backgrounds should find the tool at least as usable as the baseline subjects.
The first task required users to assess the help menu and a help demonstration that explained the process of seriation and its goal of diagonalizing a matrix and data exploration. The second task assessed the ease of learning regarding the basic functions of the software as outlined in the section above on augmented seriation, while the third task assessed the ease of use of the software functions for novice users with risk data. These first three tasks provided users with step-by-step detailed instructions. The fourth and last task requested users 'explore' an actual analysis problem using risk assessment data; this was a much less structured task.
The usability testing revealed the following opportunities to improve the software. Testing revealed that improvements to the help system are needed to support better understanding of the overall purpose of seriation and data exploration for naive users. (Such extensive demonstration and preparation for use should not be needed for those with high levels of expertise in statistical or geographic analysis but further testing is needed on this matter.) The tools for data exploration (color, icon shape, sound, maps, etc.) were very usable but naive users did not find them very useful in the less structured phase of the testing, apparently because their mental models of the process of data exploration and pattern discernment were not yet well developed. This lack of apparent usefulness was illustrated most clearly by the sound function; users were not at all sure how sounds could help them. Such lack of usefulness for these users reinforces the need for improvements in the help and demonstration features to better explain the goals of seriation and the potential support of the various exploration features.
1) Provide users with clearer representation of the purpose of seriation, 2) Provide a glossary of general and specific terminology, 3) Provide better contrast in the color schemes for the maps and legend, 4) Use darker colors for higher and larger data values and brighter colors for lower and smaller data values, 5) Provide additional explanation for the role of sound in data exploration, 6) Provide a more convenient way to delete legends from view, 7) Include a close function as well as an exit function for the help screens, 8) Include a back function in the Help demonstration, 9) Eliminate the NEXT button on the last screen of the Help demonstration; 10) Provide a more memorable mechanism to MOVE columns and rows, and 11) Provide an easier to learn and recall mechanism for thematic map and bivariate map construction.
Also suggested by the testing are six less critically needed improvements: 1) Help demonstration needs a more specific example with less generality such as replacing labels of A, B, C with more concrete labels of transportation, housing, income, etc., 2) Provide more contrast for selected (highlighted) columns or rows, 3) Provide more sound options, 4) Provide additional multivariable mapping beyond the bivariate thematic displays, 5) Provide additional matrix icon shapes and colors, and 6) Add a self-exploration section for the Help demonstration.
Muller's (1983) statement that seriation matrix manipulations may ". . . lead to an interpretation of structural relationships between geographic entities and their spatial attributes" may be expanded. Our usability testing indicates strongly that augmented seriation provides enhanced visual displays that lead more readily to these important structural relationships. Sound seems more problematic in assisting users to explore data and find meaningful patterns in data. Usability testing of the auditory and musical enhancements also may add to seriation's support for data analysis.
Our future work will 'clean up' the issues reflected by users in our testing, enhance the software with additional cartographic displays such as dot and graduated circle maps as well as additional multivariate displays, and experiment with more tonal sound (music) support. Little research has been done to explore the use of tonal articulation and ornamentation, for example, as variables to enhance data exploration (e.g., Krygier, 1994). We hope to exploit such variables and their software implementations to better understand the role sound can play in data exploration. We will also continue usability testing with differing user groups as we modify and enhance the tool. In conclusion, we believe that with these more user friendly recommendations and additional tool functionality implemented, augmented seriation will be one more efficient and effective analysis tool for researchers to consider when exploring data, especially risk perception and other spatially referenced datasets.
Cohen, Jacob and Patricia Cohen, 1983. Applied Multiple Regression/Correlation Analysis for the Behavioral Sciences. (2nd Ed.): Lawrence Erlbaum Associates, Hillsdale, NJ.
Engelbart, D.C., 1963. A Conceptual Framework for the Augmentation of Man's Intellect. In Vista in Information Handling, v1. Howerton, P.D. and Weeks, D. (Eds)., Spartan Books Washington, D.C.: pp.1-29.
Ericsson, A. and H. Simon, 1980. Verbal reports as Data. Psychological Review. 87 (3): pp. 215-251.
Foggin, P. and N. Aurillon, 1989. "Respiratory health indicators and Acculturation among the Inuit and Cree of Northern Quebec: A Regional Approach Using Geographic Seriation Analysis." Soc. Sci. Med 29(5): pp. 617-626.
Gimeno, Roberto and Jacques Bertin, 1983. "The Cartography Lesson in Elementary School." In D.R.F. Taylor (Ed.) Graphic Communication and Design in Contemporary Cartography. John Wiley & Sons Ltd: pp. 231-256.
Gluck, Myke and John McRae, 1997. Augmented Seriation: Searching for Health Care Patterns with a Multimedia Cartographic Tool. In Proceedings of International Symposium on Computer Mapping in Epidemiology and Environmental Health. Tampa, FL. pp.53-59.
Gluck, Myke, 1994. "Augmented Seriation." Presentation at Association of American Geographers (AAG) Annual Meeting. San Francisco, CA. Abstracts, p. 123.
Johnson, R.A. and Dean W. Wichern, 1988. Applied Multivariate Statistical Analysis: Prentice-Hall, Englewood Cliffs, NJ.
Kingma, J., 1986. Training of Seriation in Young Kindergartners. J. of Genetic Psychology. 148(2): pp. 167-181.
Kohler, Wolfgang, 1947. Gestalt Psychology. Mentor Books, New York, NY.
Krygier, J.B., 1994. Sound and Geographic Visualization. In Visualization in Modern Cartography MacEachren, A. and Taylor D.R.F. (Eds.) New York: Pergamon. pp. 149-166.
Liebetrau, Albert, 1983. Measures of Association. Sage University Series on Quantitative Applications in the Social Sciences, series no. 32. Sage, Beverly Hills, CA and London, England.
Monmonier, M. and A. Giordano, 1998. GIS in New York State County Emergency Management Offices: User Assessment. Applied Geographical Studies, Vol. 2, No.1, pp. 95-109.
Muller, J.C., 1983. Geographic Seriation Revisited. Professional Geographer, 35: pp. 196-202.
Muller, J.C. and J.L. Honsaker, 1983. Visual vs. Computerized Seriation: The application for Automated Map Generalization. Autocarto IV Proceedings, p. 277-287.
Norman, D.A., 1993. Things that make us smart : defending human attributes in the age of the machine.: Addison-Wesley, Reading, MA.
Petrie, W.M., 1899. Sequences in Pre-Historic Remains. J. Anthropological Institute of Great Britain and Ireland. Vol. 29: pp.295-301.
Reynolds, H.T., 1984. Analysis of Nominal Data. Sage University Series on Quantitative Applications in the Social Sciences, series no. 7. Sage, Beverly Hills, CA and London, England.
Rodgers, Joseph Lee and Tony D. Thompson, 1992. Seriation and Multidimensional Scaling: A Data Analysis Approach to Scaling Asymmetric Proximity Matrices. Applied Psychological Measurement. 16(2): pp.105-117.
Rubin, Jeffery, 1994. Handbook of Usability Testing: How to Plan Design, and Conduct Effective Tests. Wiley & Sons, New York, NY.
Shneiderman, Ben, 1992. Designing the User Interface: Strategies for Effective Human Computer Interaction. 2nd., Addison-Wesley, Reading, MA.
Taylor, Frederick W. 1911. Principles of Scientific Management. Harper and Row, New York, NY.