
|
|

|
Duncan Ray 1, Keith Reynolds2, John Slade 3 and Simon Hodge 4
1 Forest Research, Roslin, Midlothian, Scotland, UK.
2 US Forest Service, Corvallis, Oregon, US.
3 Knowledge Garden Inc. West Palm Beach, Florida, US.
4 Forest Enterprise, West Argyll Forest District, Whitegates, Lochgilphead, Argyll, Scotland, UK.
Keywords: forest, ecology, classification, management, design, decision support, knowledge base
Ecological Site Classification (ESC) is being used to define site quality in order to help British foresters satisfy sustainable management objectives. ESC takes climatic and edaphic data to assess site quality. An obvious use of the classification is to predict the ecological suitability of commercial tree species, amenity tree species and new native woodland communities on any particular site. In addition, ESC can inform other forest management decisions, such as silvicultural systems, regeneration potential, long term retention, fertilizer application, etc. The analysis can be done manually or with the aid of a computer based decision support system.
The Ecosystem Management Decision Support (EMDS) system integrates the NetWeaver knowledge base system with ArcView GIS to provide decision support technology for ecological landscape analysis applications. ESC provides decision support for individual landscape units, the EMDS implementation extends ESC to enable assessment of hundreds or thousands of units in large landscapes in a single analysis. The NetWeaver technology that underlies EMDS enables a more flexible problem-solving approach that permits evaluation of the degree of truth rather than the binary true or false of more traditional rule-based approaches. Additionally, NetWeaver allows an assessment of the effect of missing information, and the modular incorporation of knowledge bases that might evaluate a range of related topics, such as the social, economic and design value of woodlands.
This paper describes a prototype ESC-EMDS system which calculates the suitability of tree species or native woodland types at the forest landscape scale. We see this development as the core of a spatial decision support tool which will ultimately link spatial decision support system modules to evaluate the ecological impact of forest design plans. The work brings together two project teams from the Forestry Commission's Research Agency in Britain and the US Forest Service in Oregon.
|
|
|
|
The World Commission on Environment and Development (The Brundtland Commission, 1987), the Rio Summit (1992) and other international initiatives, such as the Darwin Initiative and the European Commission Habitats Directive, have focused international attention on global issues; including the conservation of biodiversity through the protection of native species and native and semi-natural habitats. The Helsinki Conference (1993) adopted a set of guidelines for the sustainable management of European forests, and bridged the gap between stewardship of native and man-made forests by providing for enhancement of biodiversity as part of sustainable management.
In 1994, the UK Forestry Commission began a Biodiversity Research Programme to focus primarily on the 1570K ha of planted secondary forests in Britain (60% of Britain's forest is secondary, mainly introduced conifer) (Hodge et al, 1998). It aims to: develop monitoring protocols and collect base-line information on species, structural and habitat diversity in secondary forests; identify biodiversity criteria and indicators for secondary forests at the ecological unit (a) and landscape (b) scale; identify and recommend practical standards by which to appraise biodiversity in secondary forests; and identify and recommend silvicultural systems and management practices that maintain and enhance biodiversity in secondary forests.
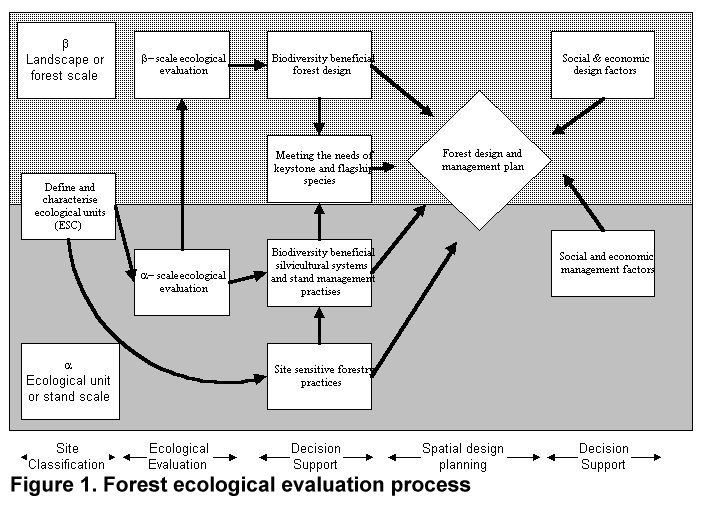
Research must be clearly focused on priority information needs, and must ensure that outputs are of practical use to forest managers. The research programme has therefore been planned around the decision making process forest managers are being encouraged to follow (Figure 1). This process will also be the framework for formulation and delivery of research outputs. The complexity of biodiversity issues precludes outputs in the form of simple and widely applicable recommendations; forest managers need access to the information and expertise that will allow them to make ecologically sound management decisions in their own particular situation. Geographical Information Systems (GIS) have been recognised as important management tools for foresters, and are set to revolutionise forest management, eg. investment appraisal and production forecast models will link with the GIS at the forest planning stage. The UK Forestry Commission and US Forest Service along with many private forest management companies are currently implementing GIS technology. For this reason, an important output will be a computer based spatial decision support system linked to a GIS and designed to lead the forest manager through the ecological appraisal of alternative forest planning options, in addition to the economic considerations which are so relevant to forestry.
Forest Research, in the UK, and the US Forest Service are collaborating to implement ESC as a spatial decision support system in the form of a knowledge base within Ecosystem Management Decision Support (EMDS), that is linked to the GIS technology that foresters are using for planning and management purposes. This paper describes the prototype implementation of ESC using EMDS.
Click on image to show opening window of ESCDSS
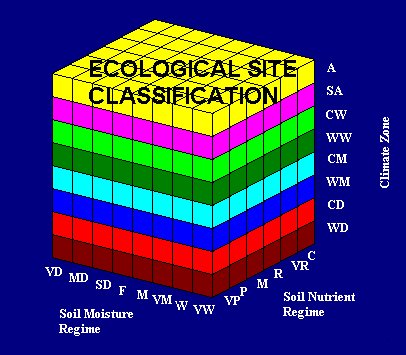
Forest managers need the means to delineate land into basic ecological units (Figure 1), and to establish the inherent characteristics and capability of each unit. The ESC project is fulfilling this need by providing a site delineation and classification system for forestry in Britain, based on six ecologically meaningful factors: accumulated temperature (AT), moisture deficit (MD), windiness (Wind), continentality (Con), soil nutrient regime (SNR) and soil moisture regime (SMR) (Pyatt 1995; Pyatt, 1996; Pyatt & Suarez, 1997). Four factors are combined to assess the climatic zone (AT, MD, Wind & Con). Site climatic variables are computed from empirically derived functions from elevation and distance from the sea for a particular grid reference. SMR is assessed from a description of the soil type, soil texture, rooting depth and stoniness. SNR is the most difficult factor to assess for a site, and a system of plant indicator species is being developed to facilitate this (Wilson, unpublished PhD thesis), following Ellenberg (1988). The six ESC factors are used to predict crop tree species suitability and yield or to choose the most appropriate new native woodland type (Rodwell, 1991; Rodwell and Patterson, 1994) either for individual ecological units, or at the landscape and regional scale using a GIS.
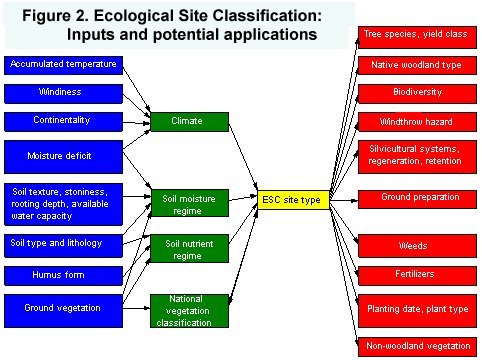
Pyatt (1996) discussed the importance of abiotic factors in mapping biological communities, and demonstrated the acceptance of the methodology throughout North America and Europe. In the US and Canada, a series of regional guides describe the theory and application of ESC-type systems for forest management: eg Ecosites of Southwestern Alberta (Archibald et al, 1996); Ecological Classification and Inventory System of the Huron-Manistee National Forests (Cleland et al, 1993). In Britain, regional guides describing the likely distribution of woodland types, based on ESC, are being published (Pyatt and Suarez, 1997; Pyatt and White, in prep). However, at the stand management scale the complexity of an ESC evaluation, suggests the system should be delivered to forest managers in the form of a non-spatial, computer-based, Ecological Site Classification Decision Support System (ESCDSS) (Ray et al, 1996; Ray, in prep). ESCDSS, currently at an advanced stage of development, will inform choice of crop species and help promote more natural forest stands, and this will be extended by the addition of modules for minimizing the ecological impact of forest operations (e.g. Use of: cultivation and drainage, fertiliser, natural regeneration) and the management of semi-natural vegetation in open habitats and riparian corridors. (Figure 2).
A major research objective is to build and provide decision support tools for managers to assess the ecological value of woodland habitat options, that will allow full cost-benefit analysis at the landscape scale, at the forest planning stage. In addition to commercial tree species suitability, ESC can assess the suitability of a site for establishing new native woodlands, and so is a tool of fundamental importance. Forming a link between a site and its (natural) native woodland ecosystem is the first step in establishing the potential biodiversity value of a site, against which the biodiversity value of alternative management options can be quantified. We therefore decided that ESC was the important central module of the planned Forest Ecology Decision Support System shown in Figure 1.
Click on image to enter EMDS home page

The EMDS system integrates the logical formalism of knowledge-based reasoning into the ArcView GIS environment (Environmental Systems Research Institute, Redlands, California) to provide decision support for ecological landscape assessment and evaluation (Reynolds et al 1998a). The system has three main components: the NetWeaver knowledge base development system; the EMDS ArcView application extension; and the Assessment system (Reynolds et al., 1997a, 1997b, 1998a). The NetWeaver knowledge base development system (Reynolds et al. 1998b) consists of an engine and a graphic user interface for developers to design, edit and interactively evaluate knowledge bases. Primary components of the EMDS ArcView application extension are the DataEngine and MapDisplay objects that customize the ArcView environment with methods and data structures required to integrate NetWeaver's knowledge-based reasoning schema into ArcView. The Assessment system is a graphic user interface to the NetWeaver engine for EMDS application end-users that controls setup and running of analyses, runtime editing of knowledge bases, and display of maps, tables, graphs, and evaluated knowledge base states, relating to analyses.
In the UK, Forest Enterprise (the agency which manages the Forestry Commission estate) divide forests and woodlands into management units called 'compartments'. Compartments are further divided into sub-compartments, which represent the smallest polygonised management units in the GIS. A sub-compartment database holds site and crop related information which can be associated with the sub-compartment polygons in the GIS. The form of the existing sub-compartment database allows two approaches to an EMDS based spatial solution to ESC:
Method 1 provides the most accurate representation of the combined ESC factors for EMDS analyses. Some initial GIS preparation is required to create ESC site type polygons for a forest district. The method requires the classification of the six layers into vector themes, and can provide a very close approximation to a 'raster' method (described below) if the scale of polygons is similar to the resolution of the data. At the landscape or catchment scale in forest districts this may be possible, but there is a trade-off between high resolution, large data sets and using larger polygons that provide more discreet spatial units but require less data. Assuming an appropriate spatial classification of the ESC factors, the data should remain valid and useful for many different analyses over a reasonable period of time (several years). A benefit of this approach is that it encourages forest managers to adjust the boundaries of management unit polygons to match the ecologically defined ESC site type polygon boundaries.
Method 2 provides an approximate solution, but it is not a true spatial solution because the ESC factors are assumed to match the sub-compartment management database boundaries, which is not always the case. For example, in the sub-compartment database, the main soil type for a management unit polygon has been coded into the database. Several soil types may occur in a sub-compartment but usually only the most extensive soil type code will have been allocated in the soil type attribute column. Using ArcView to display a map of soil types associated with sub-compartments will produce an inaccurate and approximate distribution of the soil types in the district. However, a benefit of this expedient approach is that users do not need to classify an ESC polygon theme, the analysis can be run on an existing sub-compartment database.
A third method, that will be possible in EMDS version 2.0 (September 1998 release), would hold six separate ESC factor layers or themes in the GIS, along with the vector forest sub-compartment theme. Such a technique would not require the factors to be permanently combined as a single vector theme. Thus the integrity of the ESC factors would be preserved, and this would allow complete flexibility in combining any of the ESC site data, for any subsequent analysis.
Whichever method is used, the ESC NetWeaver knowledge base that determines suitability is the same. The different methods will use different polygon shape files and will link to different database sources, but the methodology remains the same.
The prototype ESC NetWeaver knowledge base described below is formalized in networks, calculated data links and fuzzy membership functions to express crop species suitability. The NetWeaver knowledge base faithfully represents the Knowledge Pro (Knowledge Garden Inc. Florida) program code used in the non-spatial ESCDSS (Ray et al, 1996 & Ray et al, in prep), currently in the final stages of development. Data for the knowledge base is combined from various sources into a single database table using the ArcView join command. In this paper we describe a prototype spatial ESC using method 2 (above), the ' Forest management unit, sub-compartment method '. The Forestry Commission's sub-compartment database will provide sufficient information for a quick and approximate ESC site type evaluation, and until more accurate site information is collected, will often be the only source of information available. However, to meet the requirements of sustainable multi-purpose forestry, users will often require a more accurate ESC site evaluation, and an obvious restriction is likely to be lack of information for a detailed assessment of the SNR. Consequently we have designed the knowledge base to work on sub-compartment soil information as well as use additional information from humus form or lists of plant indicators if they are available, and the methodology of the knowledge base is structured in a similar way to the non-spatial ESCDSS (Figure 2). A batch mode program prepares additional data ready for joining to the sub-compartment database in preparation for an EMDS analysis.
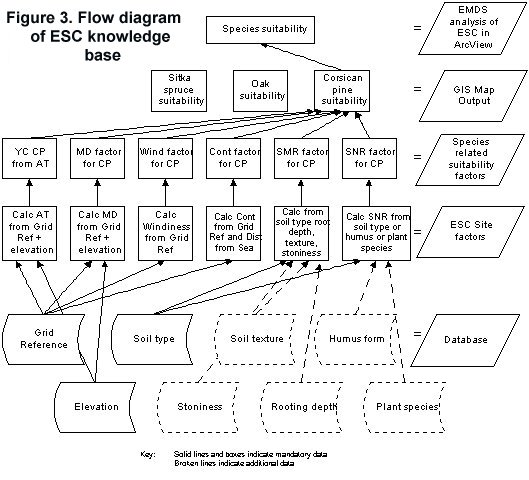
The primary structural elements of NetWeaver knowledge bases are networks that evaluate propositions. The key attribute of a network is its truth value, which is a measure of the degree to which the proposition is true, based upon the state of logically antecedent conditions. The current prototype ESC knowledge base contains networks for eight conifer species. Each network evaluates the proposition that the particular species is physiologically suited to a given site. A simplified flow diagram representation of the ESC network structure (Figure 3) shows how information from a data base cascades up through the knowledge base structure to allow an evaluation of the proposition at the apex of a network. In this case the suitability of growing Corsican pine (Pinus nigra var. maritima) is tested against the six ESC factors for a site. A similar network structure is placed under the other species being tested in the model.
NetWeaver networks generally are recursive. That is, a network may be evaluated in terms of other networks that are logically antecedent to it. However, the current version of the EMDS ESC knowledge base considers species site suitability which is calculated using empirical functions, as in the current non-spatial ESCDSS (Ray, in prep). Consequently, site suitability of each species directly depends only on one calculated data link. For example, suitability of Corsican pine is evaluated in terms of the CP yield calc calculated data link (Figure 4).
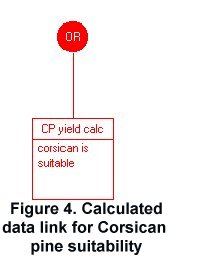
NetWeaver supports two types of data link: a simple data link, and a calculated data link. A simple data link reads a single value that may be evaluated against a simple argument or a fuzzy membership function specified for the data link (yielding a truth value), or the datum value may by used directly by a network or calculated data link. A simple argument tests for a simple true/false condition as in classical rule-based systems based on bivalent logic. An argument represented by a fuzzy membership function tests an observed value's degree of membership in a fuzzy subset (Kaufmann 1975, Zadeh 1992). Fuzzy membership functions provide an explicit mathematical expression for testing an observation's degree of affinity for the concept represented by the fuzzy subset. Calculated data links evaluate an expression composed of mathematical operators, simple data links and other calculated data links. As with simple data links, the result of the mathematical operations specified in a calculated data link may be evaluated against a simple argument or a fuzzy membership function specified for the data link. Or the result may be used directly in a network or another calculated data link.
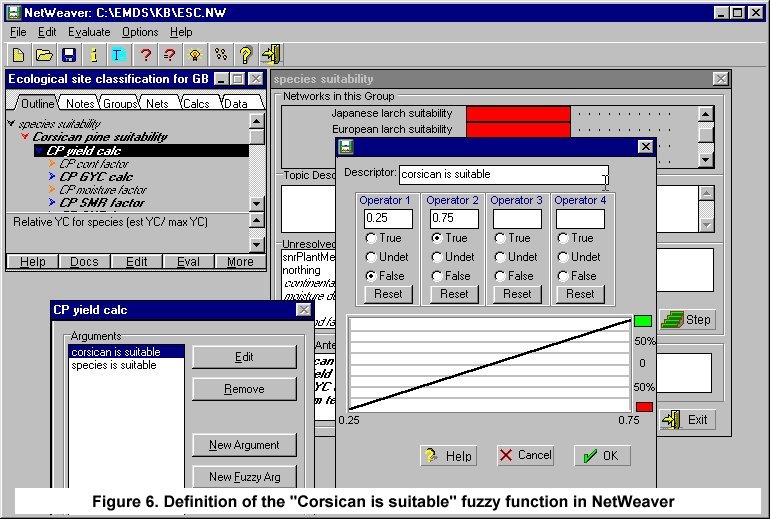
The network for Corsican pine suitability contains a reference to the CP yield calc calculated data link (Figure 4). The data link contains the fuzzy membership function "corsican is suitable" that defines the relationship between predicted yield value of Corsican pine and the proposition that the site is suitable for the species. The fuzzy function defines the degree of membership of Corsican pine suitability expressed in terms of the ratio of predicted yield to maximum yield (scale 0-1) on the horizontal axis (Figure 6). Corsican pine suitability is completely false if the ratio is equal to or less than 0.25 and completely true if the ratio is equal to or greater than 0.75. Ratios between 0.25 and 0.75 are expressed as truth values between these limits.
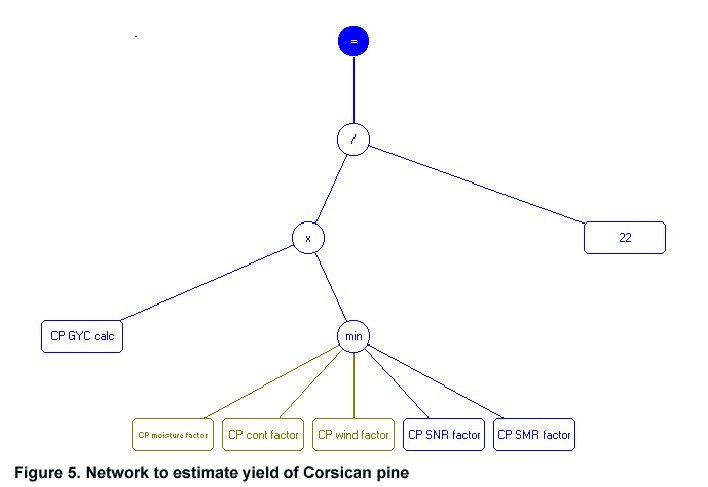
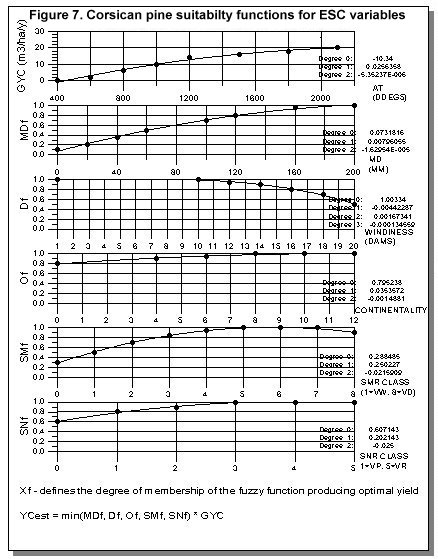
To test species or native woodland suitability, ESC matches site class factors with the species or woodland type suitability criteria classes (Pyatt and Suarez, 1997). The method has been modified to use continuous curves representing species suitability against the range of values in MD, Wind, Con, SMR and SNR. In this model, the potential yield (rate of growth) of a species is assumed to vary with temperature (Worrell, 1987; Worrell and Malcolm, 1990; Jobling, 1990). However the potential yield will rarely be realized because one of the five remaining ESC factors will limit growth. In ESC, yield for a given species is predicted by estimating its potential yield from AT, and then modifying this value by the limiting ESC site factor. Continuous suitability functions have been developed, for eight conifer species, from experimental evidence and experience of species trials across Britain. Figure 7 shows continuous functions for Corsican pine (CP), in which the predicted yield (CP yield calc) is the product of potential yield (PYC) (estimated from the site accumulated temperature) and the minimum (most limiting) ESC factor. The CP yield model structure is specified graphically in the CP yield calc calculated data link (Figure 5) and is equivalent to the mathematical statement:
CP yield calc = [CP PYC calc · MIN{CP moisture factor, CP cont factor, …}]/22
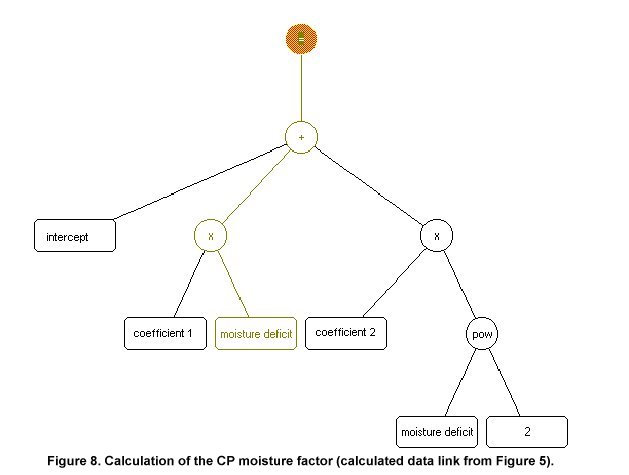
Each of the terms in the MIN expression (Figure 5) is a calculated data link. The CP moisture factor calculated data link, referenced in the CP yield calc calculated data link (Figure 8), computes a moisture factor specific to Corsican pine. Specifications for the other calculated data links similarly implement the ESC model (Ray, in prep). Because calculated data links may evaluate expressions containing other calculated data links, calculations may extend arbitrarily many levels deep in a knowledge base structure. Chains of calculations, organised in networks of calculated data links, frequently are used in NetWeaver to avoid building extremely large expressions within a single calculated data link.
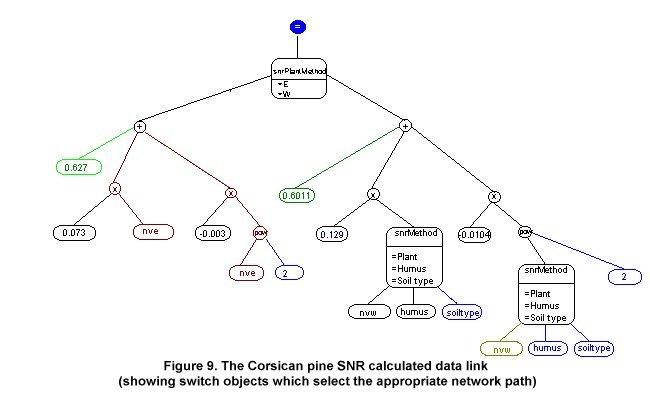
The specification of the CP SNR factor calculated data link (Figure 9) illustrates the use of logical switching in NetWeaver. Two rounded boxes in Figure 9 indicate switch objects that read the value associated with a data link (snrPlantMethod and snrMethod) and select the appropriate network path. For example, the switch referencing snrPlantMethod reads the datum associated with the snrPlantMethod data link and implements the left path if the datum is e (Ellenberg method) and the right path if the datum value is w (Wilson method). In the complete knowledge base, switches are used to choose the general method for computing soil nutrient regime (Ellenberg versus Wilson, choose a specific method (plant-, humus-, or soil type-basis), assign a nutrient equivalent based on humus type or on the soil type (both using the Wilson method).
Once a knowledge base has been constructed in NetWeaver, it can be applied to hundreds or thousands of landscape features in the EMDS Arcview extension to perform landscape analyses. Basic steps to set up an EMDS Arcview project are:
Generally, the association between simple data link names in the knowledge base and data fields in GIS themes is established in step 1, above. The EMDS application includes a startup program that automates step 2. Step 3 uses Arcview's standard import methods to include the base project in the EMDS project. The EMDS Arcview extension contains a DataCatalog object with methods for creating and operating on data lookup tables (steps 3 and 4) that define the association between NetWeaver simple data link names, theme attribute fields, and the file sources of specific data fields in GIS themes for use in an EMDS analysis.
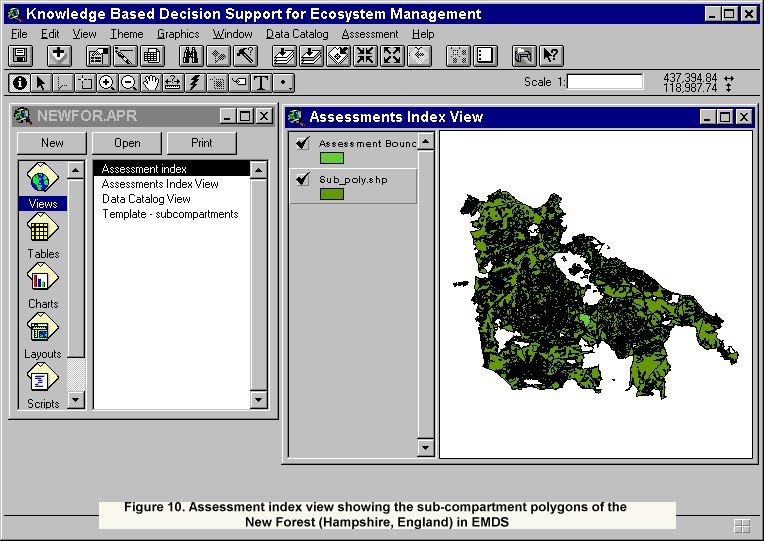
EMDS analyses are set up and run in the EMDS Assessment System (Figure 10). Any networks defined in a NetWeaver knowledge base can be selected for inclusion in analyses. After an initial default analysis has been performed, data values may be overridden to run alternative scenarios or to define default data values for missing data fields at run time. It is also possible to ignore network components of a knowledge base when those components are not considered relevant in specific geographic contexts. For cases in which the data needed for analysis are not complete, the Assessment system can report the influence of missing information, and assist users with prioritizing further data collection. Finally, EMDS version 1.5 has recently added the ability to browse details of the state of an evaluated knowledge base in a NetWeaver-like interface.
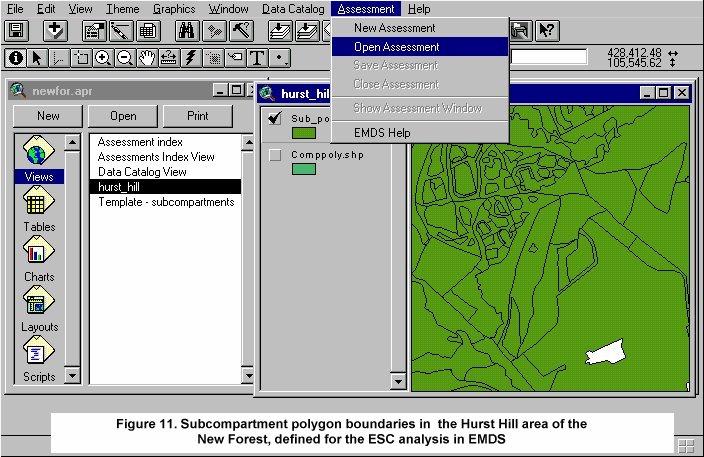
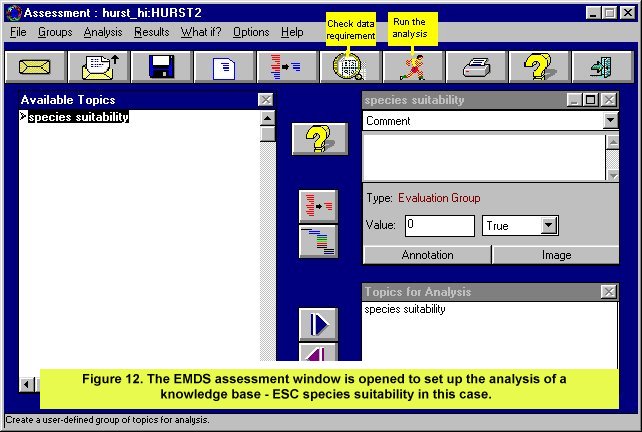
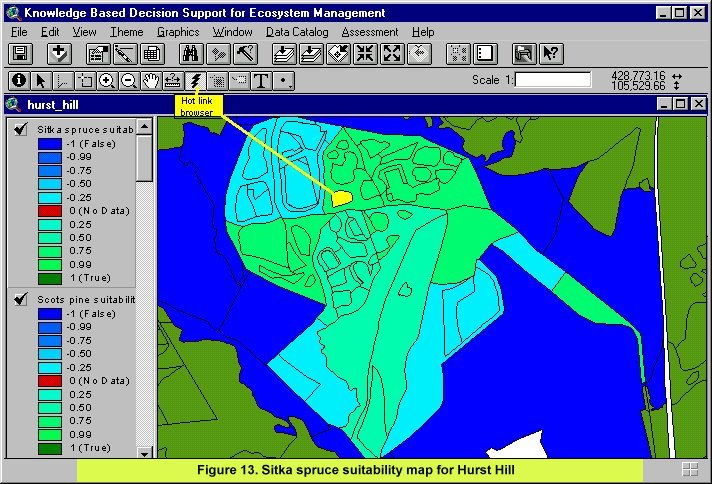
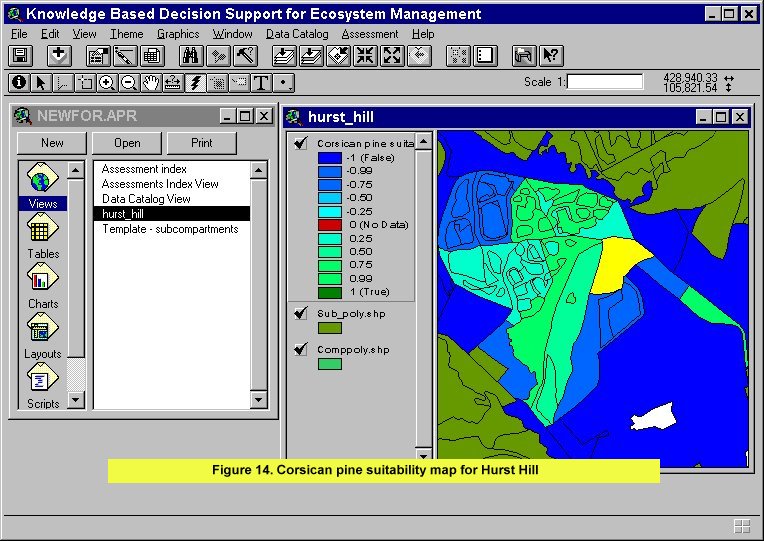
An analysis begins by using the Arcview selection tool to define an analysis area and selecting 'New Assessment' on the Assessment menu. The area selected in Figure 11 is for the Hurst Hill Enclosure of the New Forest in Hampshire, England. After creating a new EMDS assessment, or opening an existing one, the 'Show Assessment Window' item is selected on the Assessment menu to set up analysis of a knowledge base (Figure 12). Generally, a knowledge base is automatically loaded in the Assessment Window at start up and its expandable topic outline is displayed in the Available Topics Window. NetWeaver networks associated with each topic displayed in the dependency structure can be expanded by selecting the '>' symbol and can be selected for analysis by moving into the lower right hand 'Topics for Analysis' window. Once the analysis has been saved, data requirements are checked to ensure the knowledge base can access the data base, and the analysis is performed. Output from the analysis is viewed as an ArcView map. Figure 13 shows the species suitability output for the selected theme Sitka spruce, and Figure 14 shows the suitability distribution of Corsican pine at Hurst Hill.
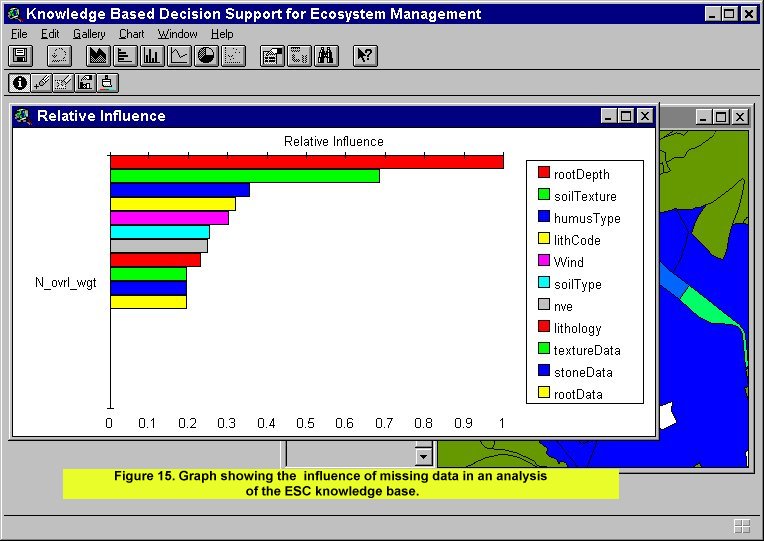
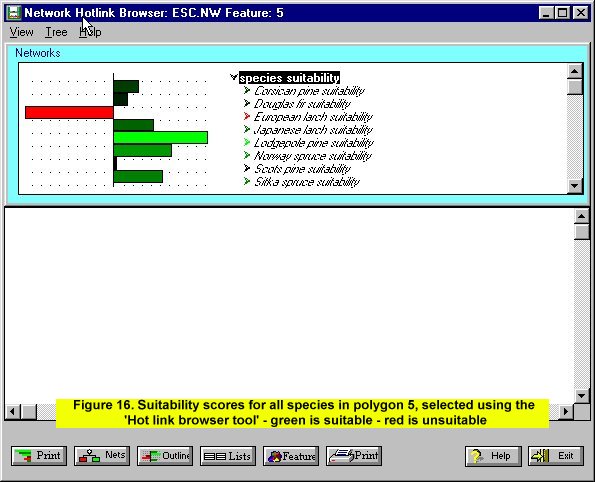
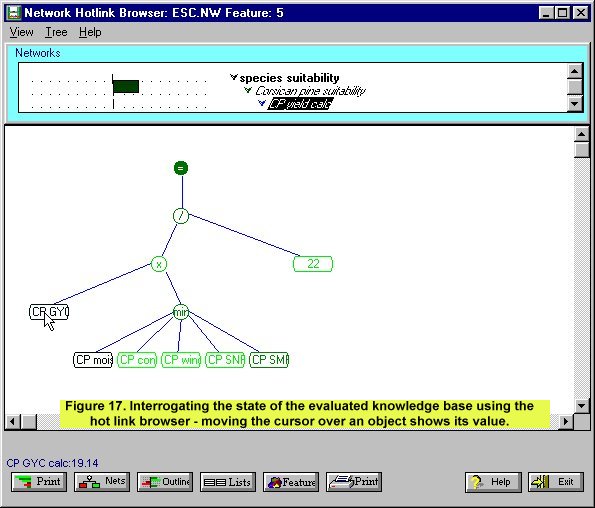
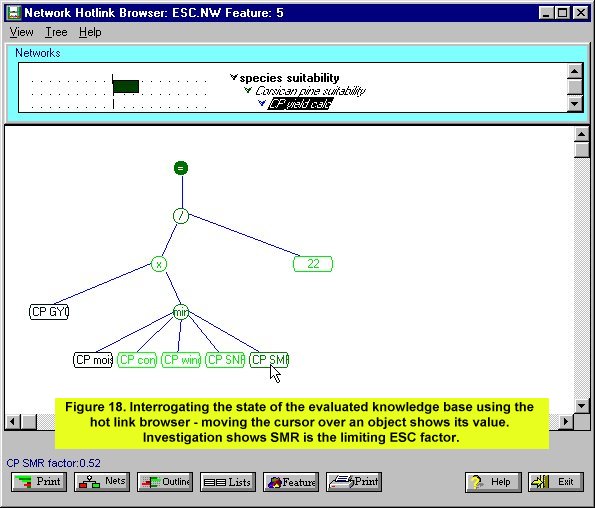
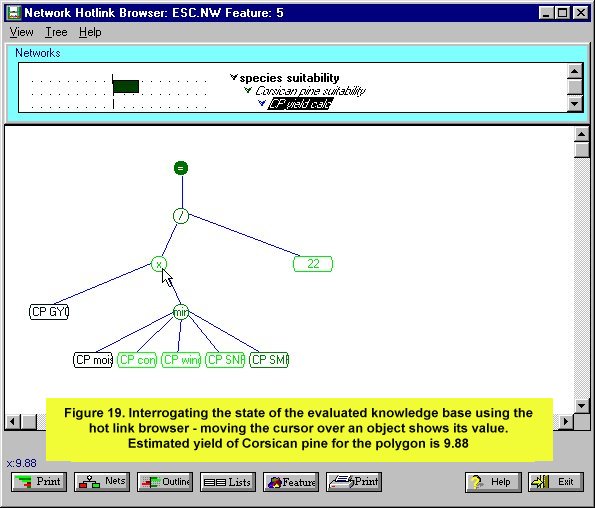
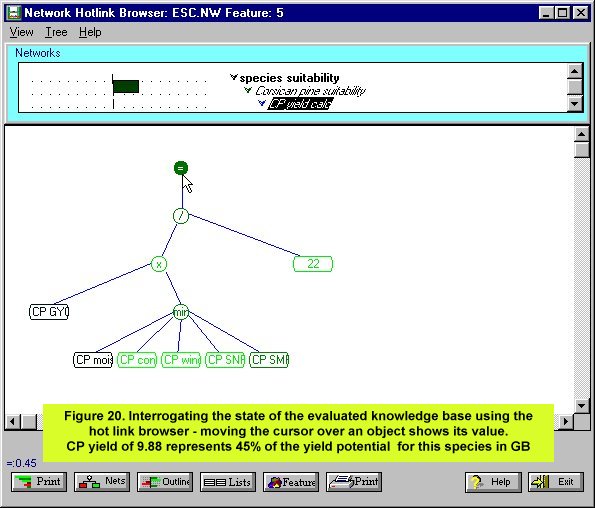
In addition to performing a basic evaluation of a knowledge base, EMDS provides a variety of other features to aid analysis. EMDS analyzes the relative influence of missing data, if any, with respect to the logical completeness of an assessment (Figure 15). This is a very powerful tool for example in analysing the cost-benefit of acquiring more data or prioritizing research assessments. Missing data can be further prioritized to take account of the ease with which it can be acquired, and map output options include maps of missing observations. Knowledge base structures can be edited at runtime to assign missing values or to disable components within the knowledge base structure that are not relevant in specific geographic contexts. Data values also can be edited to explore alternative scenarios. Perhaps most significant is the ability to browse the evaluated state of a knowledge base. The hot link browser tool enables the user to interrogate the state of a knowledge base. For example Figure 16 shows the suitability scores of the eight species for the polygon 'number 5' selected with the hot link browser tool. Suitability scores are displayed as eight horizontal bars, ranging from red (false) at the left hand side of the bar chart, to green (true) at the right hand side of the bar chart. Bars between red and green show varying degrees of 'truth', remembering that values of truth are false when the ratio of estimated yield:maximum yield is less than 0.25, and true when the ratio is greater than or equal to 0.75. The complete network can be interogated from this point. Selecting (clicking) one of the species codes associated with a bar opens the network which calculates the value in that part of the knowledge base, Figure 17 shows the network node which estimates the yield of Corsican pine for polygon 5. Note that the hot link browser shows the value of each node in the network, simply by moving the cursor over the node. Figure 17 shows that the maximum yield of Corsican pine in polygon 5, determined from AT, is 19.14. Further examination of the CP yield calc network, shows that the ESC factor limiting a yield of 19.14 is SMR with a factor value of 0.52 (Figure 18). The estimated yield class for CP in this polygon is therefore 19.14 x 0.52 = 9.88 (Figure 19) shown as the product (x sign) in the network, and that 9.88 divided by the maximum potential yield of Corsican pine in Britain (YC22) is 0.45 (Figure 20), ie. 45% of the yield potential for this species in the UK
EMDS has offered a relatively simple and practical method of implementing a GIS version of ESC. The prototype ESC knowledge base demonstrated here, shows the relative ease with which the original ESC methodology could be converted to propositional networks in EMDS. The knowledge base technology that underlies EMDS enables flexible problem representations to be constructed and evaluated according to the degree of truth of a problem hypothesis. Output from EMDS (eg., truth values of species or native woodland community suitability) provide meaningful information to the forest manager. EMDS also analyses and displays truth values of all objects in its network hierarchy so forest managers can quickly investigate limiting factors in an analysis to assess the degree of risk in making a particular decision. Although this prototype ESC knowledge base tests species suitability, the logic representation used in NetWeaver makes it quite feasible to introduce numerous and diverse topics for more general ecological assessment into a single, integrated analysis. For example, the scope of the knowledge base could be expanded to include topics related to social, economic and design values. Complementing NetWeaver's logic representation, the underlying object model (Booch, 1994), as well as the modular design approach of the development interface, provide effective support for the incremental evolution of knowledge bases (Gall, 1986).
The British Forestry Commission through its three arms: Forest Enterprise, The Forestry Authority and Forest Research, promotes the management of forests for multiple benefits, including the conservation of forest biodiversity. Biodiversity Evaluation Tools (BETS) (Hodge et al, 1998) are being developed to measure the biodiversity value of plantation and semi-natural forest types in Britain, and are being discussed and proposed for use in Europe within a European funded Concerted Action Programme. Interpreting the effects of management on forest ecology is complex, as any decision will often affect many parts of a forest ecosystem. Consequently, the long term objective is to assemble the results and conclusions of current forest ecology studies in the form of a forest ecology decision support system, to guide the forest manager through the decision making process. However, forest ecosystems operate at a range of scales and within a range of habitat components, and so a GIS implementation of ecological decision support tools will be needed in order to assess the mosaic of stands and their juxtaposition at the landscape scale. We think that EMDS will provide a flexible platform on which knowledge base modules can analyse the ecological suitability of forest design plans.
We aim to provide forest managers with a GIS based forest ecology decision support system to predict the effect of forest planning and management options on forest habitats, ecosystems, and key indicator species, thereby enabling more informed decision making at the planning stage. The prototype ESC knowledge base descibed is the first module of this development, and we envisage EMDS will allow continued flexible development of additional modules to provide a spatial cost-benefit analysis model (Figure 1) for forest planning.
This project is supported by the UK Forestry Authority, the USDA Forest Service and NATO Scientific and Environmental Affairs Division.
Archibald, J.H., Klappstein, G.D. and Corns, I.G.W (1996) Field guide to ecosites of Southwestern Alberta. Special Report 8. Canadian Forest Service, Northwest Region. (ISSN 1187419;8).
Booch G (1994) Object-oriented analysis and design with applications. New York: Benjamin/Cummings.
Brundtland Commission (1987) Our Common Future. Report of the World Commission on Environment and Development. Chaired by Mrs G H Brundtland.
Cleland, D.T, Hart, J.B, Host, G.E, Pregitzer, K,S. and Ramm, C.W (1993) Ecological Classification and Inventory System of the Huron-Maiistee National Forests. USDA Forest Service, Field Guide.
Ellenberg, H (1988) Vegetation ecology of Central Europe (Fourth edition - English translation), Cambridge University Press, Cambridge.
Gall, J. (1986) Systematics: how systems really work and how they fail. Ann Arbor, MI: The General Systematics Press.
Helsinki Conference (1993) Ministerial Conference on the Protection of European Forests.
Hodge, S.J., Patterson, G. and McIntosh, R. (1998) The approach of the British Forestry Commission to the conservation of forest biodiversity. In: Bachmann, P., Kohl, M. and Paivinen, R.. Assessment of biodiversity for improved forest planning, European Forestry Institute Proceedings No 18, p91-101.
Jobling, J. (1990) Poplars for wood production and amenity. Bulletin 92. Forestry Commission, HMSO, London.
Kaufmann, A. (1975) Introduction to the theory of fuzzy subsets. Volume 1. Fundamental theoretical elements. New York: Academic Press. 416 p.
Pyatt, D.G. (1995) An Ecological Site Classification for Great Britain. Research Information Note 260, Forestry Commission, Edinburgh.
Pyatt D G (1996) Biological conservation and site classification; the importance of abiotic variables. In: Conservation Biology, edited by I F Spellerberg. Longman.
Pyatt, D.G. and Suarez, J.C. (1997) An Ecological Site Classification for Forestry in Great Britain: with special reference to Grampian Scotland. Technical Paper 20, Forestry Commission, Edinburgh.
Pyatt, D.G., and White, G.S.A (in prep) An Ecological Site Classification for forestry in Wales.
Ray, D., Suarez, J. and Pyatt, D.G. (1996) Development of an Ecological Site Classification System Decision Support System for British Forestry. Proceedings: 1st International Conference on GeoComputation, Leeds University, September 1996.
Ray, D., Suarez, J. and Pyatt, D.G. (in prep) Development of an Ecological Site Classification System Decision Support System for British Forestry. Forestry.
Reynolds, K., Saunders, M., Miller, B., Murray, S., and Slade, J. (1997a) An application framework for decision support in environmental assessment. Pages 333-337 in: GIS 97 Conference Proceedings of the Eleventh Annual Symposium on Geographic Information Systems. Vancouver, BC. February 17-20, 1997. Washington, DC: GIS World.
Reynolds, K., Saunders, M., Miller, B., Slade, J., and Murray, S. (1997b) Knowledge-based decision support in environmental assessment. Pages 344-352 in: Resource Technology 97 Conference Proceedings Volume 4. ACSM 57th Annual Convention. ASPRS 63rd Annual Convention. Seattle, WA. April 7-10, 1997. Bethesda, MD: American Society for Photogrammetry and Remote Sensing and American Congress on Surveying and Mapping.
Reynolds, K., Slade, J, Saunders, M., Miller, B. (1998a) EMDS users guide (version 2.0): knowledge-based decision support for ecological assessment. Gen. Tech. Rep. PNW-GTR-XX. Portland, OR: U.S. Department of Agriculture, Forest Service, Pacific Northwest Research Station. XX p. (in press)
Reynolds, K., Slade, J., Saunders, M., Miller, B. (1998b) NetWeaver for EMDS version 2.0 user guide: a knowledge base development system. Gen. Tech. Rep. PNW-GTR-XX. Portland, OR: U.S. Department of Agriculture, Forest Service, Pacific Northwest Research Station. XX p. (in press)
Rio Summit (1992) United Nations Conference on Environment and Development: a Statement of Forest Principles, Agenda 21, the Biodiversity Convention.
Rodwell, J.S. and Patterson, G.S. (1994) Creating new native woodlands. Forestry Commission Bulletin 112, HMSO. London.
Rodwell, J.S. (ed.) (1991) British plant communities, I: Woodlands and scrub. Cambridge University Press, Cambridge.
Wilson, S.McG. (1998) The quantification of soil nutrient regime in British forests and its assessment from ground vegetation and humus type. Unpublished PhD Thesis, University of Edinburgh.
Worrell, R. (1987) Predicting the productivity of Sitka spruce on upland sites in northern Britain. Bulletin 72. Forestry Commission, HMSO, London.
Worrell, R. and Malcolm, D.C. (1990) Productivity of Sitka spruce in northern Britain. 1. The effects of elevation and climate. Forestry, 63, pp105-118.
Zadeh, L.A. (1992) Knowledge representation in fuzzy logic. Pages 1-25 in: R.R. Yager and L.A. Zadeh (eds.), An introduction to fuzzy logic applications in intelligent systems. Boston: Kluwer Academic Publishers. 356 p.