Multiple Regression
This is the same as regression but accounts for multiply independant
variables.
The values can be seen below:
Data input is similar to linear regression each observation is entered
into a row in the data table and each variable is
represented by a column.
1. Enter the data into 3 columns. Named appriopately.
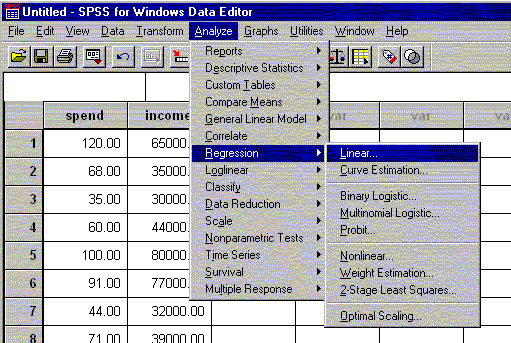
2. Click on analysis the n regression, and then linear. As shown below in figure 1
Figure 1.
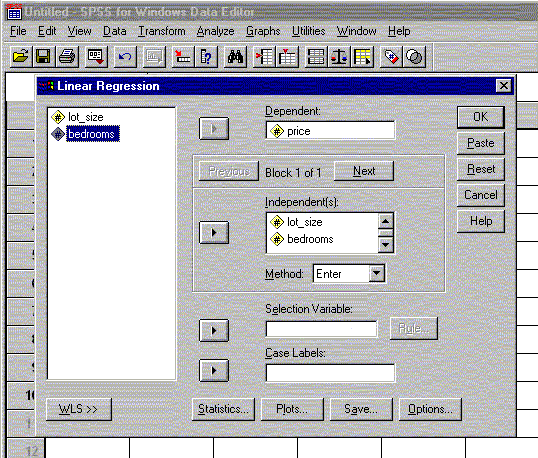
3. Then move the dependent variable into the the box labelled
dependent. Followed by moving the
independent variables into the box marked
independent as in Fig 2.
Figure 2
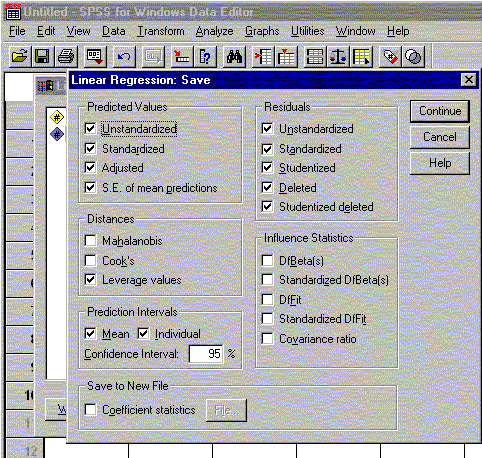
4. There are anumber of option available under the save item see
Figure 3. These include predicted values, residuals,
leverage values to detect outliers and confidence
limits. These will then be attached to the datset as new columns.
Figure 3
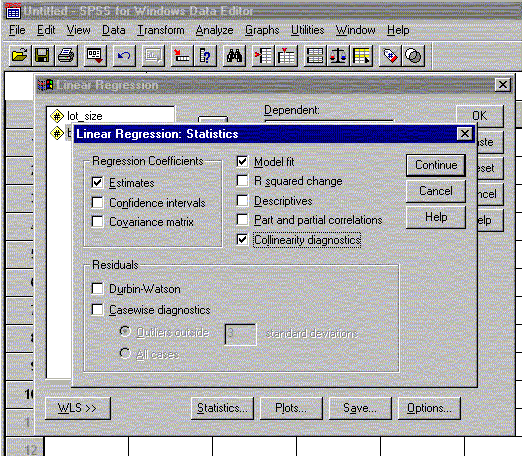
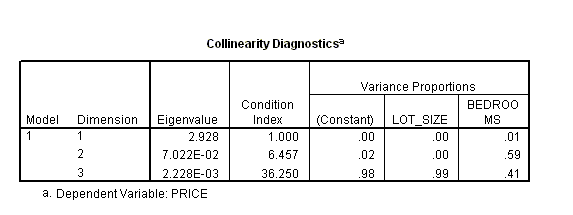
5. Also available under statistics is collinearity diagnostics
to check for multi collinearity as it is assumed in mulitple
regression that there is no multi collinearity
among independent variables see Figure 4.
Figure 4
6. Clicking OK on linear regression will perform the regression
analysis this produces a regression of the dependent variable
vs the independent variable. Output
will consised of the variables entered or removed, model summary including
R and R square,
Anova statistics and coefficients. Additional
output may include collinearity diagnostics. For an example see Figure
5.
Figure 5
Return to SPSS homepage